
|
Softcat plc (sct.l) avaliação dcf |
Totalmente Editável: Adapte-Se Às Suas Necessidades No Excel Ou Planilhas
Design Profissional: Modelos Confiáveis E Padrão Da Indústria
Pré-Construídos Para Uso Rápido E Eficiente
Compatível com MAC/PC, totalmente desbloqueado
Não É Necessária Experiência; Fácil De Seguir
Softcat plc (SCT.L) Bundle
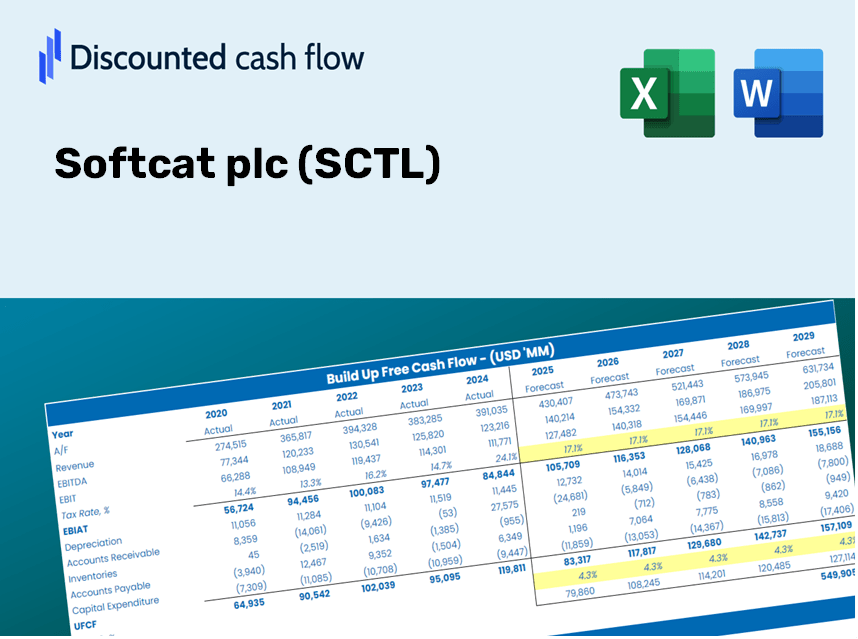
Seja você um investidor ou analista, esta calculadora DCF (SCTL) é sua ferramenta essencial para uma avaliação precisa. Carregado com dados reais do Softcat PLC, você pode ajustar as previsões e observar instantaneamente os efeitos.
Discounted Cash Flow (DCF) - (USD MM)
| Year | AY1 2021 |
AY2 2022 |
AY3 2023 |
AY4 2024 |
AY5 2025 |
FY1 2026 |
FY2 2027 |
FY3 2028 |
FY4 2029 |
FY5 2030 |
|---|---|---|---|---|---|---|---|---|---|---|
| Revenue | 784.0 | 1,077.9 | 985.3 | 962.6 | 1,458.4 | 1,743.1 | 2,083.4 | 2,490.2 | 2,976.4 | 3,557.4 |
| Revenue Growth, % | 0 | 37.48 | -8.59 | -2.3 | 51.5 | 19.52 | 19.52 | 19.52 | 19.52 | 19.52 |
| EBITDA | 124.2 | 143.6 | 147.0 | 166.5 | 190.7 | 259.6 | 310.3 | 370.8 | 443.2 | 529.8 |
| EBITDA, % | 15.85 | 13.32 | 14.92 | 17.29 | 13.08 | 14.89 | 14.89 | 14.89 | 14.89 | 14.89 |
| Depreciation | 4.9 | 4.5 | 6.1 | 6.6 | 10.5 | 10.7 | 12.8 | 15.3 | 18.3 | 21.9 |
| Depreciation, % | 0.62394 | 0.41978 | 0.62093 | 0.68811 | 0.719 | 0.61435 | 0.61435 | 0.61435 | 0.61435 | 0.61435 |
| EBIT | 119.3 | 139.1 | 140.9 | 159.8 | 180.3 | 248.9 | 297.5 | 355.5 | 425.0 | 507.9 |
| EBIT, % | 15.22 | 12.9 | 14.3 | 16.6 | 12.36 | 14.28 | 14.28 | 14.28 | 14.28 | 14.28 |
| Total Cash | 101.7 | 97.3 | 122.6 | 158.5 | 182.3 | 221.1 | 264.2 | 315.8 | 377.4 | 451.1 |
| Total Cash, percent | .0 | .0 | .0 | .0 | .0 | .0 | .0 | .0 | .0 | .0 |
| Account Receivables | 315.7 | 529.4 | 460.2 | 552.1 | 694.3 | 840.4 | 1,004.4 | 1,200.5 | 1,434.9 | 1,715.0 |
| Account Receivables, % | 40.27 | 49.11 | 46.7 | 57.36 | 47.61 | 48.21 | 48.21 | 48.21 | 48.21 | 48.21 |
| Inventories | 38.4 | 5.1 | 3.6 | 2.9 | 151.9 | 57.4 | 68.6 | 82.0 | 98.0 | 117.1 |
| Inventories, % | 4.9 | 0.47349 | 0.36446 | 0.30292 | 10.42 | 3.29 | 3.29 | 3.29 | 3.29 | 3.29 |
| Accounts Payable | 220.3 | 280.8 | 254.9 | 290.9 | 285.9 | 452.6 | 541.0 | 646.6 | 772.9 | 923.8 |
| Accounts Payable, % | 28.1 | 26.05 | 25.87 | 30.22 | 19.6 | 25.97 | 25.97 | 25.97 | 25.97 | 25.97 |
| Capital Expenditure | -6.5 | -5.2 | -3.2 | -1.1 | -11.8 | -8.9 | -10.7 | -12.8 | -15.3 | -18.2 |
| Capital Expenditure, % | -0.82444 | -0.48463 | -0.32934 | -0.11583 | -0.80793 | -0.51243 | -0.51243 | -0.51243 | -0.51243 | -0.51243 |
| Tax Rate, % | 25.36 | 25.36 | 25.36 | 25.36 | 25.36 | 25.36 | 25.36 | 25.36 | 25.36 | 25.36 |
| EBITAT | 96.5 | 112.8 | 111.3 | 119.4 | 134.5 | 194.2 | 232.2 | 277.5 | 331.7 | 396.4 |
| Depreciation | ||||||||||
| Changes in Account Receivables | ||||||||||
| Changes in Inventories | ||||||||||
| Changes in Accounts Payable | ||||||||||
| Capital Expenditure | ||||||||||
| UFCF | -38.9 | -7.8 | 159.0 | 69.5 | -162.9 | 311.3 | 147.4 | 176.2 | 210.6 | 251.7 |
| WACC, % | 7.46 | 7.46 | 7.46 | 7.45 | 7.45 | 7.46 | 7.46 | 7.46 | 7.46 | 7.46 |
| PV UFCF | ||||||||||
| SUM PV UFCF | 892.9 | |||||||||
| Long Term Growth Rate, % | 2.00 | |||||||||
| Free cash flow (T + 1) | 257 | |||||||||
| Terminal Value | 4,704 | |||||||||
| Present Terminal Value | 3,283 | |||||||||
| Enterprise Value | 4,176 | |||||||||
| Net Debt | -147 | |||||||||
| Equity Value | 4,323 | |||||||||
| Diluted Shares Outstanding, MM | 201 | |||||||||
| Equity Value Per Share | 2,152.50 |
What You Will Receive
- Adjustable Forecast Assumptions: Effortlessly modify key factors (growth %, margins, WACC) to explore various scenarios.
- Comprehensive Market Data: Softcat plc’s financial information pre-loaded to facilitate your analysis.
- Automated DCF Calculations: The template computes Net Present Value (NPV) and intrinsic value automatically.
- Customizable and Professional Design: A sleek Excel model tailored to meet your valuation requirements.
- Designed for Analysts and Investors: Perfect for assessing projections, validating strategies, and enhancing efficiency.
Key Features
- Customizable Financial Inputs: Adjust essential parameters such as revenue growth, operating margins, and capital investments.
- Instant DCF Valuation: Quickly determines the intrinsic value, NPV, and other relevant metrics.
- High-Precision Accuracy: Utilizes Softcat plc's (SCTL) actual financial data for reliable valuation results.
- Simplified Scenario Analysis: Effortlessly evaluate various assumptions and analyze their impacts.
- Efficiency Booster: Avoid the hassle of constructing intricate valuation models from the ground up.
How It Functions
- Download: Obtain the pre-prepared Excel file containing financial data for Softcat plc (SCTL).
- Customize: Tailor forecasts such as revenue growth, EBITDA %, and WACC according to your needs.
- Update Automatically: Intrinsic value and NPV calculations refresh in real-time as you make adjustments.
- Test Scenarios: Generate various projections and evaluate results immediately.
- Make Decisions: Leverage the valuation outcomes to inform your investment approach.
Why Choose This Calculator for Softcat plc (SCTL)?
- Precision: Utilizes verified Softcat financials for reliable data.
- Adaptability: Built for users to freely experiment and adjust their inputs.
- Efficiency: Eliminate the need to create a DCF model from the ground up.
- High-Quality: Crafted with the accuracy and usability expected at a CFO level.
- Intuitive: Simple to navigate, even for those lacking advanced financial modeling skills.
Who Can Benefit from This Product?
- Investors: Accurately determine the fair value of Softcat plc (SCTL) before making investment choices.
- CFOs: Utilize a high-quality DCF model for precise financial reporting and analysis.
- Consultants: Efficiently modify the template for client valuation reports.
- Entrepreneurs: Discover insights into the financial modeling practices of leading companies.
- Educators: Employ it as a teaching resource to illustrate valuation techniques.
Contents of the Template
- Operating and Balance Sheet Data: Pre-filled historical data and forecasts for Softcat plc (SCTL), encompassing revenue, EBITDA, EBIT, and capital expenditures.
- WACC Calculation: A dedicated worksheet for the Weighted Average Cost of Capital (WACC), featuring parameters such as Beta, risk-free rate, and share price.
- DCF Valuation (Unlevered and Levered): Customizable Discounted Cash Flow models providing intrinsic value along with comprehensive calculations.
- Financial Statements: Pre-loaded annual and quarterly financial statements to facilitate thorough analysis.
- Key Ratios: A compilation of profitability, leverage, and efficiency ratios specifically for Softcat plc (SCTL).
- Dashboard and Charts: A visual summary of valuation outputs and assumptions designed for easy result analysis.
Disclaimer
All information, articles, and product details provided on this website are for general informational and educational purposes only. We do not claim any ownership over, nor do we intend to infringe upon, any trademarks, copyrights, logos, brand names, or other intellectual property mentioned or depicted on this site. Such intellectual property remains the property of its respective owners, and any references here are made solely for identification or informational purposes, without implying any affiliation, endorsement, or partnership.
We make no representations or warranties, express or implied, regarding the accuracy, completeness, or suitability of any content or products presented. Nothing on this website should be construed as legal, tax, investment, financial, medical, or other professional advice. In addition, no part of this site—including articles or product references—constitutes a solicitation, recommendation, endorsement, advertisement, or offer to buy or sell any securities, franchises, or other financial instruments, particularly in jurisdictions where such activity would be unlawful.
All content is of a general nature and may not address the specific circumstances of any individual or entity. It is not a substitute for professional advice or services. Any actions you take based on the information provided here are strictly at your own risk. You accept full responsibility for any decisions or outcomes arising from your use of this website and agree to release us from any liability in connection with your use of, or reliance upon, the content or products found herein.