|
Avaliação Secureworks Corp. (SCWX) DCF |
Totalmente Editável: Adapte-Se Às Suas Necessidades No Excel Ou Planilhas
Design Profissional: Modelos Confiáveis E Padrão Da Indústria
Pré-Construídos Para Uso Rápido E Eficiente
Compatível com MAC/PC, totalmente desbloqueado
Não É Necessária Experiência; Fácil De Seguir
SecureWorks Corp. (SCWX) Bundle
Explore o futuro financeiro da Secureworks Corp. (SCWX) com nossa calculadora DCF! Digite suas projeções de crescimento, margens e despesas para calcular o valor intrínseco da Secureworks Corp. (SCWX) e aprimore sua abordagem de investimento.
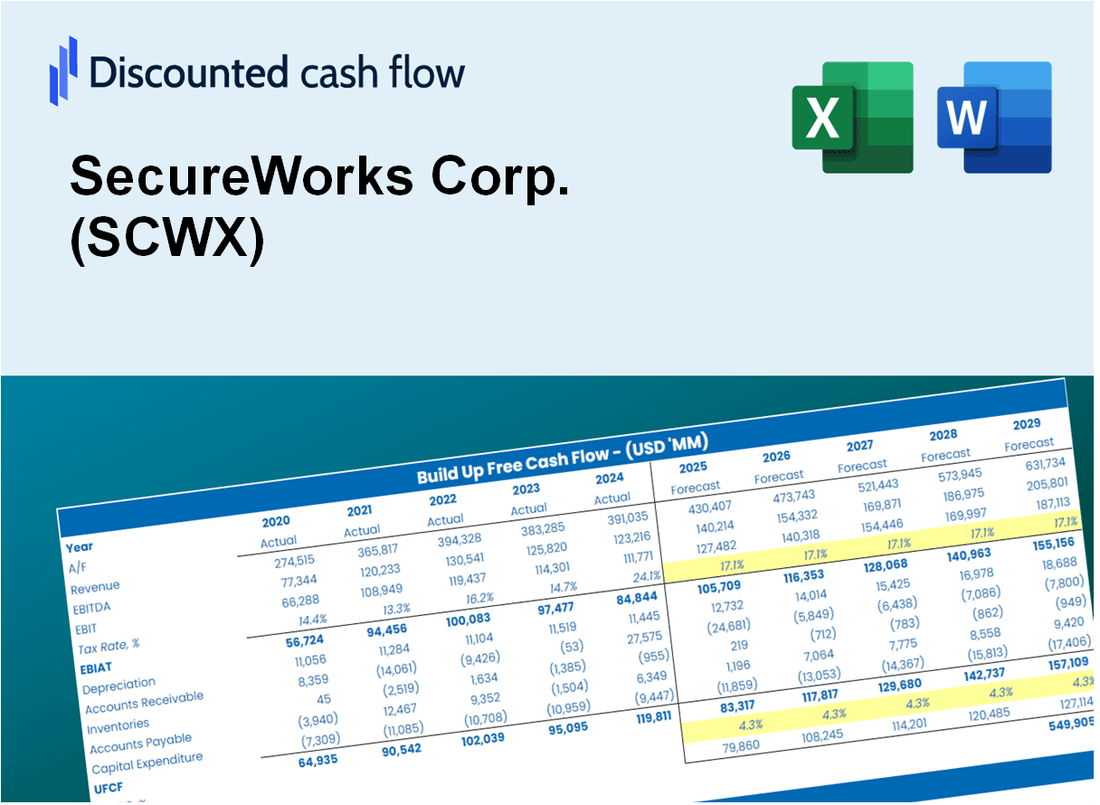
Discounted Cash Flow (DCF) - (USD MM)
| Year | AY1 2020 |
AY2 2021 |
AY3 2022 |
AY4 2023 |
AY5 2024 |
FY1 2025 |
FY2 2026 |
FY3 2027 |
FY4 2028 |
FY5 2029 |
|---|---|---|---|---|---|---|---|---|---|---|
| Revenue | 552.8 | 561.0 | 535.2 | 463.5 | 365.9 | 331.5 | 300.4 | 272.2 | 246.6 | 223.4 |
| Revenue Growth, % | 0 | 1.5 | -4.6 | -13.4 | -21.06 | -9.39 | -9.39 | -9.39 | -9.39 | -9.39 |
| EBITDA | -9.2 | 8.8 | -6.4 | -101.5 | -60.9 | -26.4 | -23.9 | -21.7 | -19.7 | -17.8 |
| EBITDA, % | -1.67 | 1.56 | -1.19 | -21.91 | -16.65 | -7.97 | -7.97 | -7.97 | -7.97 | -7.97 |
| Depreciation | 42.9 | 41.6 | 49.6 | 45.2 | 33.9 | 28.8 | 26.1 | 23.7 | 21.4 | 19.4 |
| Depreciation, % | 7.77 | 7.42 | 9.26 | 9.76 | 9.27 | 8.69 | 8.69 | 8.69 | 8.69 | 8.69 |
| EBIT | -52.2 | -32.8 | -55.9 | -146.8 | -94.8 | -55.2 | -50.1 | -45.4 | -41.1 | -37.2 |
| EBIT, % | -9.44 | -5.85 | -10.45 | -31.67 | -25.92 | -16.66 | -16.66 | -16.66 | -16.66 | -16.66 |
| Total Cash | 181.8 | 220.3 | 220.7 | 143.5 | 68.7 | 108.2 | 98.0 | 88.8 | 80.5 | 72.9 |
| Total Cash, percent | .0 | .0 | .0 | .0 | .0 | .0 | .0 | .0 | .0 | .0 |
| Account Receivables | 111.8 | 108.0 | 86.2 | 72.6 | 59.4 | 58.0 | 52.6 | 47.6 | 43.1 | 39.1 |
| Account Receivables, % | 20.23 | 19.25 | 16.11 | 15.67 | 16.22 | 17.5 | 17.5 | 17.5 | 17.5 | 17.5 |
| Inventories | .7 | .6 | .5 | .6 | .7 | .4 | .4 | .4 | .3 | .3 |
| Inventories, % | 0.13496 | 0.0998157 | 0.09435478 | 0.13377 | 0.1987 | 0.13232 | 0.13232 | 0.13232 | 0.13232 | 0.13232 |
| Accounts Payable | 18.7 | 16.8 | 15.1 | 18.8 | 9.0 | 10.4 | 9.4 | 8.5 | 7.7 | 7.0 |
| Accounts Payable, % | 3.38 | 2.99 | 2.81 | 4.07 | 2.45 | 3.14 | 3.14 | 3.14 | 3.14 | 3.14 |
| Capital Expenditure | -12.6 | -3.0 | -8.0 | -5.7 | -6.4 | -4.8 | -4.4 | -4.0 | -3.6 | -3.3 |
| Capital Expenditure, % | -2.28 | -0.53562 | -1.5 | -1.22 | -1.76 | -1.46 | -1.46 | -1.46 | -1.46 | -1.46 |
| Tax Rate, % | 24.87 | 24.87 | 24.87 | 24.87 | 24.87 | 24.87 | 24.87 | 24.87 | 24.87 | 24.87 |
| EBITAT | -32.2 | -22.6 | -39.8 | -114.5 | -71.2 | -39.2 | -35.5 | -32.2 | -29.2 | -26.4 |
| Depreciation | ||||||||||
| Changes in Account Receivables | ||||||||||
| Changes in Inventories | ||||||||||
| Changes in Accounts Payable | ||||||||||
| Capital Expenditure | ||||||||||
| UFCF | -95.7 | 18.1 | 21.9 | -57.6 | -40.5 | -12.1 | -9.3 | -8.4 | -7.6 | -6.9 |
| WACC, % | 9.27 | 9.3 | 9.31 | 9.33 | 9.32 | 9.31 | 9.31 | 9.31 | 9.31 | 9.31 |
| PV UFCF | ||||||||||
| SUM PV UFCF | -35.1 | |||||||||
| Long Term Growth Rate, % | 2.00 | |||||||||
| Free cash flow (T + 1) | -7 | |||||||||
| Terminal Value | -96 | |||||||||
| Present Terminal Value | -62 | |||||||||
| Enterprise Value | -97 | |||||||||
| Net Debt | -61 | |||||||||
| Equity Value | -36 | |||||||||
| Diluted Shares Outstanding, MM | 86 | |||||||||
| Equity Value Per Share | -0.42 |
What You Will Receive
- Adjustable Forecast Inputs: Effortlessly modify assumptions (growth %, margins, WACC) to explore various scenarios.
- Industry-Specific Data: SecureWorks Corp. (SCWX) financial data pre-loaded to facilitate your analysis.
- Automated DCF Outputs: The template computes Net Present Value (NPV) and intrinsic value automatically.
- Customizable and Professional Design: A sleek Excel model that tailors to your valuation requirements.
- Designed for Analysts and Investors: Perfect for evaluating projections, validating strategies, and enhancing efficiency.
Key Features
- Comprehensive Security Analytics: Robust tools for threat detection and response tailored for SecureWorks Corp. (SCWX).
- Incident Response Services: Pre-configured protocols for rapid incident management and resolution.
- Customizable Risk Assessments: Adjust risk parameters and security controls based on specific business needs.
- Integrated Compliance Framework: Evaluate adherence to industry regulations and standards relevant to SecureWorks Corp. (SCWX).
- Interactive Reporting Dashboard: Visual insights and metrics to facilitate informed decision-making in cybersecurity.
How It Works
- Download: Obtain the pre-configured Excel file featuring SecureWorks Corp.'s (SCWX) financial data.
- Customize: Tailor forecasts, such as revenue growth, EBITDA %, and WACC to fit your analysis.
- Update Automatically: The intrinsic value and NPV calculations refresh in real-time as you make changes.
- Test Scenarios: Generate various projections and instantly compare the results.
- Make Decisions: Leverage the valuation outcomes to inform your investment approach.
Why Choose SecureWorks Corp. (SCWX) Solutions?
- Designed for Security Experts: A specialized tool utilized by cybersecurity analysts, IT professionals, and risk managers.
- Comprehensive Threat Data: Access to extensive historical and projected threat intelligence for precise analysis.
- Incident Simulation: Easily model various security scenarios and response strategies.
- Insightful Reports: Automatically generates detailed risk assessments, incident reports, and key performance indicators.
- User-Friendly Interface: Intuitive navigation with clear instructions to streamline your experience.
Who Should Use This Product?
- Investors: Accurately assess SecureWorks Corp.'s (SCWX) fair value prior to making investment choices.
- CFOs: Utilize a professional-grade DCF model for financial reporting and analysis related to SecureWorks Corp. (SCWX).
- Consultants: Easily customize the template for valuation reports tailored to SecureWorks Corp. (SCWX) clients.
- Entrepreneurs: Acquire insights into financial modeling practices employed by leading cybersecurity firms like SecureWorks Corp. (SCWX).
- Educators: Implement it as a teaching resource to illustrate valuation techniques relevant to SecureWorks Corp. (SCWX).
What the Template Contains
- Pre-Filled Data: Features SecureWorks Corp.’s historical financials and projections.
- Discounted Cash Flow Model: Editable DCF valuation model with automated calculations.
- Weighted Average Cost of Capital (WACC): A dedicated sheet for calculating WACC based on user-defined inputs.
- Key Financial Ratios: Evaluate SecureWorks Corp.’s profitability, efficiency, and leverage metrics.
- Customizable Inputs: Easily modify revenue growth, profit margins, and tax rates.
- Clear Dashboard: Visuals and tables summarizing essential valuation outcomes.
Disclaimer
All information, articles, and product details provided on this website are for general informational and educational purposes only. We do not claim any ownership over, nor do we intend to infringe upon, any trademarks, copyrights, logos, brand names, or other intellectual property mentioned or depicted on this site. Such intellectual property remains the property of its respective owners, and any references here are made solely for identification or informational purposes, without implying any affiliation, endorsement, or partnership.
We make no representations or warranties, express or implied, regarding the accuracy, completeness, or suitability of any content or products presented. Nothing on this website should be construed as legal, tax, investment, financial, medical, or other professional advice. In addition, no part of this site—including articles or product references—constitutes a solicitation, recommendation, endorsement, advertisement, or offer to buy or sell any securities, franchises, or other financial instruments, particularly in jurisdictions where such activity would be unlawful.
All content is of a general nature and may not address the specific circumstances of any individual or entity. It is not a substitute for professional advice or services. Any actions you take based on the information provided here are strictly at your own risk. You accept full responsibility for any decisions or outcomes arising from your use of this website and agree to release us from any liability in connection with your use of, or reliance upon, the content or products found herein.