
|
Semapa - Sociedade de Investimento e Gestão, SGPS, S.A. (SEM.LS) DCF Avaliação |
Totalmente Editável: Adapte-Se Às Suas Necessidades No Excel Ou Planilhas
Design Profissional: Modelos Confiáveis E Padrão Da Indústria
Pré-Construídos Para Uso Rápido E Eficiente
Compatível com MAC/PC, totalmente desbloqueado
Não É Necessária Experiência; Fácil De Seguir
Semapa - Sociedade de Investimento e Gestão, SGPS, S.A. (SEM.LS) Bundle
Descubra o verdadeiro potencial da Semapa - Sociedade de Investimento e Gestão, SGPS, S.A. (SEMLS) com nossa calculadora DCF avançada! Ajuste as suposições essenciais, explore vários cenários e avalie como as mudanças afetam a avaliação da Semapa - Sociedade de Investimento e Gestão, SGPS, S.A. (SEMLS) - tudo dentro de um modelo de excel amigável.
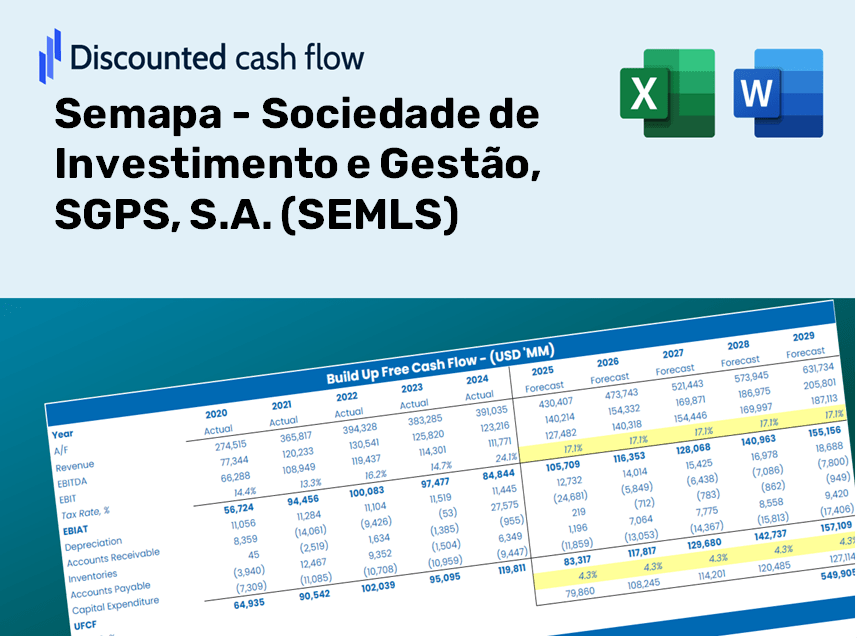
Discounted Cash Flow (DCF) - (USD MM)
| Year | AY1 2020 |
AY2 2021 |
AY3 2022 |
AY4 2023 |
AY5 2024 |
FY1 2025 |
FY2 2026 |
FY3 2027 |
FY4 2028 |
FY5 2029 |
|---|---|---|---|---|---|---|---|---|---|---|
| Revenue | 1,867.4 | 2,131.4 | 3,122.0 | 2,706.3 | 2,849.4 | 2,829.4 | 2,809.6 | 2,790.0 | 2,770.4 | 2,751.0 |
| Revenue Growth, % | 0 | 14.14 | 46.48 | -13.31 | 5.29 | -0.70024 | -0.70024 | -0.70024 | -0.70024 | -0.70024 |
| EBITDA | 421.2 | 506.5 | 836.0 | 691.0 | 643.3 | 685.9 | 681.1 | 676.3 | 671.6 | 666.9 |
| EBITDA, % | 22.56 | 23.76 | 26.78 | 25.53 | 22.58 | 24.24 | 24.24 | 24.24 | 24.24 | 24.24 |
| Depreciation | 220.6 | 197.6 | 239.0 | 222.2 | 212.5 | 251.3 | 249.5 | 247.8 | 246.0 | 244.3 |
| Depreciation, % | 11.81 | 9.27 | 7.66 | 8.21 | 7.46 | 8.88 | 8.88 | 8.88 | 8.88 | 8.88 |
| EBIT | 200.6 | 308.9 | 597.0 | 468.8 | 430.8 | 434.6 | 431.6 | 428.5 | 425.5 | 422.6 |
| EBIT, % | 10.74 | 14.49 | 19.12 | 17.32 | 15.12 | 15.36 | 15.36 | 15.36 | 15.36 | 15.36 |
| Total Cash | 444.8 | 382.3 | 593.4 | 281.2 | 501.4 | 502.2 | 498.7 | 495.2 | 491.7 | 488.3 |
| Total Cash, percent | .0 | .0 | .0 | .0 | .0 | .0 | .0 | .0 | .0 | .0 |
| Account Receivables | 332.8 | 426.3 | 478.4 | 588.7 | 518.5 | 526.8 | 523.1 | 519.5 | 515.8 | 512.2 |
| Account Receivables, % | 17.82 | 20 | 15.32 | 21.75 | 18.2 | 18.62 | 18.62 | 18.62 | 18.62 | 18.62 |
| Inventories | 236.5 | 259.4 | 393.5 | 397.5 | 425.1 | 379.4 | 376.8 | 374.1 | 371.5 | 368.9 |
| Inventories, % | 12.67 | 12.17 | 12.6 | 14.69 | 14.92 | 13.41 | 13.41 | 13.41 | 13.41 | 13.41 |
| Accounts Payable | 74.2 | 158.6 | 66.8 | 414.3 | 488.2 | 260.3 | 258.5 | 256.6 | 254.8 | 253.1 |
| Accounts Payable, % | 3.97 | 7.44 | 2.14 | 15.31 | 17.13 | 9.2 | 9.2 | 9.2 | 9.2 | 9.2 |
| Capital Expenditure | -121.4 | -143.1 | -182.8 | -263.5 | -302.0 | -223.0 | -221.4 | -219.9 | -218.3 | -216.8 |
| Capital Expenditure, % | -6.5 | -6.72 | -5.85 | -9.74 | -10.6 | -7.88 | -7.88 | -7.88 | -7.88 | -7.88 |
| Tax Rate, % | 36.95 | 36.95 | 36.95 | 36.95 | 36.95 | 36.95 | 36.95 | 36.95 | 36.95 | 36.95 |
| EBITAT | 138.6 | 228.4 | 328.7 | 284.3 | 271.6 | 279.7 | 277.7 | 275.8 | 273.9 | 272.0 |
| Depreciation | ||||||||||
| Changes in Account Receivables | ||||||||||
| Changes in Inventories | ||||||||||
| Changes in Accounts Payable | ||||||||||
| Capital Expenditure | ||||||||||
| UFCF | -257.4 | 251.0 | 107.0 | 476.2 | 298.5 | 117.4 | 310.4 | 308.2 | 306.0 | 303.9 |
| WACC, % | 4.37 | 4.48 | 4.05 | 4.18 | 4.23 | 4.26 | 4.26 | 4.26 | 4.26 | 4.26 |
| PV UFCF | ||||||||||
| SUM PV UFCF | 1,175.8 | |||||||||
| Long Term Growth Rate, % | 0.50 | |||||||||
| Free cash flow (T + 1) | 305 | |||||||||
| Terminal Value | 8,122 | |||||||||
| Present Terminal Value | 6,593 | |||||||||
| Enterprise Value | 7,768 | |||||||||
| Net Debt | 1,243 | |||||||||
| Equity Value | 6,525 | |||||||||
| Diluted Shares Outstanding, MM | 80 | |||||||||
| Equity Value Per Share | 81.70 |
What You Will Receive
- Authentic Semapa Data: Preloaded financials – from revenue to EBIT – grounded in actual and projected figures.
- Comprehensive Customization: Modify essential parameters (yellow cells) such as WACC, growth %, and tax rates.
- Immediate Valuation Adjustments: Automatic updates to evaluate the effects of changes on Semapa’s fair value.
- Flexible Excel Template: Designed for quick modifications, scenario analysis, and detailed forecasts.
- Efficient and Precise: Bypass the hassle of building models from scratch while ensuring accuracy and adaptability.
Key Features
- Pre-Loaded Data: Semapa's historical financial statements and pre-filled forecasts.
- Fully Adjustable Inputs: Modify WACC, tax rates, revenue growth, and EBITDA margins.
- Instant Results: View Semapa's intrinsic value recalculating in real time.
- Clear Visual Outputs: Dashboard charts illustrate valuation results and key metrics.
- Built for Accuracy: A professional tool designed for analysts, investors, and finance experts.
How It Functions
- Download the Template: Gain immediate access to the Excel-based SEMLS DCF Calculator.
- Input Your Variables: Modify the yellow-highlighted cells for growth rates, WACC, profit margins, and more.
- Real-Time Calculations: The model automatically recalculates Semapa’s intrinsic value.
- Explore Scenarios: Test various assumptions to assess potential fluctuations in valuation.
- Evaluate and Decide: Utilize the results to inform your investment strategies or financial analysis.
Why Opt for This Calculator?
- User-Friendly Design: Tailored for both novices and seasoned professionals.
- Customizable Parameters: Effortlessly adjust inputs to suit your financial analysis.
- Real-Time Updates: Watch immediate fluctuations in Semapa's valuation as you modify inputs.
- Preloaded Data: Comes equipped with Semapa's actual financial figures for swift assessments.
- Professionally Endorsed: Favored by investors and analysts to guide their decision-making processes.
Who Can Benefit from Semapa's Services?
- Finance Students: Explore investment strategies and apply them using real-time data.
- Researchers: Integrate professional analysis models into academic studies or projects.
- Investors: Validate your investment strategies and assess valuation scenarios for Semapa (SEMLS).
- Financial Analysts: Enhance your analysis process with a customizable financial model tailored to your needs.
- Entrepreneurs: Understand the evaluation of large investment firms like Semapa (SEMLS) to inform your own business decisions.
Contents of the Template
- Operating and Balance Sheet Data: Pre-filled historical data and forecasts for Semapa (SEMLS), including revenue, EBITDA, EBIT, and capital expenditures.
- WACC Calculation: A dedicated sheet for the Weighted Average Cost of Capital (WACC), featuring parameters such as Beta, risk-free rate, and share price.
- DCF Valuation (Unlevered and Levered): Customizable Discounted Cash Flow models that present intrinsic value with comprehensive calculations.
- Financial Statements: Pre-loaded annual and quarterly financial statements to facilitate thorough analysis.
- Key Ratios: Contains profitability, leverage, and efficiency ratios specific to Semapa (SEMLS).
- Dashboard and Charts: A visual overview of valuation outputs and underlying assumptions for straightforward result analysis.
Disclaimer
All information, articles, and product details provided on this website are for general informational and educational purposes only. We do not claim any ownership over, nor do we intend to infringe upon, any trademarks, copyrights, logos, brand names, or other intellectual property mentioned or depicted on this site. Such intellectual property remains the property of its respective owners, and any references here are made solely for identification or informational purposes, without implying any affiliation, endorsement, or partnership.
We make no representations or warranties, express or implied, regarding the accuracy, completeness, or suitability of any content or products presented. Nothing on this website should be construed as legal, tax, investment, financial, medical, or other professional advice. In addition, no part of this site—including articles or product references—constitutes a solicitation, recommendation, endorsement, advertisement, or offer to buy or sell any securities, franchises, or other financial instruments, particularly in jurisdictions where such activity would be unlawful.
All content is of a general nature and may not address the specific circumstances of any individual or entity. It is not a substitute for professional advice or services. Any actions you take based on the information provided here are strictly at your own risk. You accept full responsibility for any decisions or outcomes arising from your use of this website and agree to release us from any liability in connection with your use of, or reliance upon, the content or products found herein.