
|
Seplat Energy PLC (SEPL.L) Avaliação DCF |
Totalmente Editável: Adapte-Se Às Suas Necessidades No Excel Ou Planilhas
Design Profissional: Modelos Confiáveis E Padrão Da Indústria
Pré-Construídos Para Uso Rápido E Eficiente
Compatível com MAC/PC, totalmente desbloqueado
Não É Necessária Experiência; Fácil De Seguir
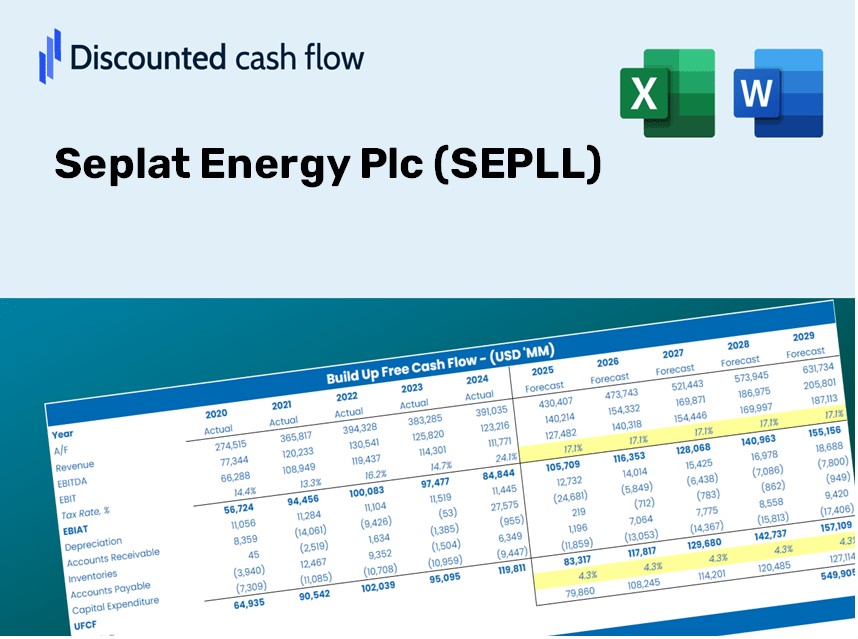
Seplat Energy Plc (SEPL.L) Bundle
Procurando determinar o valor intrínseco do Seplat Energy PLC? Nossa calculadora DCF SEPLL integra dados do mundo real com extensos recursos de personalização, permitindo refinar suas previsões e aprimorar suas opções de investimento.
Discounted Cash Flow (DCF) - (USD MM)
| Year | AY1 2020 |
AY2 2021 |
AY3 2022 |
AY4 2023 |
AY5 2024 |
FY1 2025 |
FY2 2026 |
FY3 2027 |
FY4 2028 |
FY5 2029 |
|---|---|---|---|---|---|---|---|---|---|---|
| Revenue | 392.6 | 542.7 | 704.5 | 785.5 | 826.2 | 1,001.1 | 1,213.1 | 1,470.0 | 1,781.3 | 2,158.5 |
| Revenue Growth, % | 0 | 38.22 | 29.82 | 11.5 | 5.17 | 21.18 | 21.18 | 21.18 | 21.18 | 21.18 |
| EBITDA | 79.9 | 299.2 | 304.0 | 316.6 | 387.3 | 412.1 | 499.4 | 605.1 | 733.3 | 888.5 |
| EBITDA, % | 20.35 | 55.14 | 43.15 | 40.31 | 46.87 | 41.16 | 41.16 | 41.16 | 41.16 | 41.16 |
| Depreciation | 100.9 | 111.6 | 102.3 | 123.9 | 150.0 | 189.6 | 229.8 | 278.4 | 337.4 | 408.8 |
| Depreciation, % | 25.7 | 20.56 | 14.52 | 15.77 | 18.15 | 18.94 | 18.94 | 18.94 | 18.94 | 18.94 |
| EBIT | -21.0 | 187.7 | 201.7 | 192.7 | 237.3 | 222.5 | 269.6 | 326.7 | 395.9 | 479.7 |
| EBIT, % | -5.35 | 34.58 | 28.63 | 24.54 | 28.72 | 22.22 | 22.22 | 22.22 | 22.22 | 22.22 |
| Total Cash | 166.6 | 240.2 | 299.3 | 333.2 | 347.8 | 427.8 | 518.5 | 628.2 | 761.3 | 922.5 |
| Total Cash, percent | .0 | .0 | .0 | .0 | .0 | .0 | .0 | .0 | .0 | .0 |
| Account Receivables | 60.1 | 86.7 | 49.4 | 82.3 | 269.4 | 162.9 | 197.4 | 239.2 | 289.9 | 351.3 |
| Account Receivables, % | 15.3 | 15.98 | 7.01 | 10.47 | 32.61 | 16.27 | 16.27 | 16.27 | 16.27 | 16.27 |
| Inventories | 55.2 | 55.5 | 41.0 | 38.8 | 349.8 | 154.9 | 187.7 | 227.5 | 275.7 | 334.1 |
| Inventories, % | 14.06 | 10.22 | 5.82 | 4.94 | 42.34 | 15.48 | 15.48 | 15.48 | 15.48 | 15.48 |
| Accounts Payable | 100.0 | 89.1 | 80.4 | 89.7 | 271.4 | 195.4 | 236.8 | 286.9 | 347.7 | 421.3 |
| Accounts Payable, % | 25.47 | 16.42 | 11.42 | 11.42 | 32.85 | 19.52 | 19.52 | 19.52 | 19.52 | 19.52 |
| Capital Expenditure | -111.0 | -125.7 | -129.8 | -136.1 | -154.1 | -211.9 | -256.8 | -311.2 | -377.0 | -456.9 |
| Capital Expenditure, % | -28.26 | -23.17 | -18.42 | -17.33 | -18.65 | -21.17 | -21.17 | -21.17 | -21.17 | -21.17 |
| Tax Rate, % | 59.58 | 59.58 | 59.58 | 59.58 | 59.58 | 59.58 | 59.58 | 59.58 | 59.58 | 59.58 |
| EBITAT | -22.3 | 150.0 | 103.3 | 83.8 | 95.9 | 140.2 | 169.9 | 205.9 | 249.5 | 302.3 |
| Depreciation | ||||||||||
| Changes in Account Receivables | ||||||||||
| Changes in Inventories | ||||||||||
| Changes in Accounts Payable | ||||||||||
| Capital Expenditure | ||||||||||
| UFCF | -47.6 | 98.1 | 119.0 | 50.1 | -224.7 | 343.3 | 116.9 | 141.7 | 171.7 | 208.1 |
| WACC, % | 5.18 | 4.7 | 4.01 | 3.83 | 3.75 | 4.29 | 4.29 | 4.29 | 4.29 | 4.29 |
| PV UFCF | ||||||||||
| SUM PV UFCF | 875.4 | |||||||||
| Long Term Growth Rate, % | 0.50 | |||||||||
| Free cash flow (T + 1) | 209 | |||||||||
| Terminal Value | 5,511 | |||||||||
| Present Terminal Value | 4,466 | |||||||||
| Enterprise Value | 5,342 | |||||||||
| Net Debt | 719 | |||||||||
| Equity Value | 4,623 | |||||||||
| Diluted Shares Outstanding, MM | 588 | |||||||||
| Equity Value Per Share | 785.56 |
Benefits You'll Receive
- Authentic SEPLL Financial Data: Pre-filled with Seplat Energy's historical and projected figures for accurate analysis.
- Completely Customizable Template: Easily adjust key inputs such as revenue growth, WACC, and EBITDA % to suit your needs.
- Instantaneous Calculations: Watch as Seplat Energy's intrinsic value updates in real-time based on your modifications.
- Expert Valuation Tool: Tailored for investors, analysts, and consultants who require precise DCF outcomes.
- Intuitive User Interface: A straightforward layout and clear guidance suitable for users at any experience level.
Key Features
- Pre-Loaded Data: Seplat Energy Plc’s historical financial statements alongside pre-filled forecasts.
- Fully Adjustable Inputs: Modify WACC, tax rates, revenue growth, and EBITDA margins as needed.
- Instant Results: Watch Seplat Energy Plc's intrinsic value update in real time.
- Clear Visual Outputs: Dashboard charts present valuation results and key metrics effectively.
- Built for Accuracy: A professional-grade tool designed for analysts, investors, and finance professionals.
How It Functions
- Download the Template: Gain immediate access to the Excel-based SEPLL DCF Calculator.
- Enter Your Assumptions: Modify the yellow-highlighted cells for growth rates, WACC, margins, and other parameters.
- Automatic Calculations: The model promptly recalculates Seplat Energy’s intrinsic value.
- Explore Scenarios: Experiment with various assumptions to assess potential changes in valuation.
- Evaluate and Decide: Utilize the findings to inform your investment or financial evaluation.
Why Choose Seplat Energy Plc (SEPLL) Calculator?
- Time Efficient: Skip the hassle of building a DCF model from the ground up – it’s ready for immediate use.
- Enhanced Accuracy: Dependable financial data and formulas minimize valuation errors.
- Completely Customizable: Adjust the model to align with your specific assumptions and forecasts.
- User-Friendly: Intuitive charts and outputs facilitate easy analysis of results.
- Endorsed by Professionals: Crafted for experts who prioritize precision and functionality.
Who Can Benefit from This Product?
- Individual Investors: Gain insights to make well-informed choices regarding the purchase or sale of Seplat Energy Plc (SEPLL) shares.
- Financial Analysts: Enhance valuation procedures with pre-designed financial models tailored for Seplat Energy Plc (SEPLL).
- Consultants: Provide clients with accurate and timely valuation insights related to Seplat Energy Plc (SEPLL).
- Business Owners: Learn how the valuation of major players like Seplat Energy Plc (SEPLL) can inform your strategic decisions.
- Finance Students: Acquire practical knowledge of valuation techniques through real-world data and case studies on Seplat Energy Plc (SEPLL).
What the Template Includes
- Operating and Balance Sheet Data: Pre-populated historical data and forecasts for Seplat Energy Plc (SEPLL), featuring metrics such as revenue, EBITDA, EBIT, and capital expenditures.
- WACC Calculation: A dedicated tab for calculating the Weighted Average Cost of Capital (WACC), incorporating elements like Beta, risk-free rate, and share price.
- DCF Valuation (Unlevered and Levered): Customizable Discounted Cash Flow models that reveal intrinsic value along with comprehensive calculations.
- Financial Statements: Pre-loaded annual and quarterly financial statements to facilitate thorough analysis.
- Key Ratios: A range of profitability, leverage, and efficiency ratios specifically for Seplat Energy Plc (SEPLL).
- Dashboard and Charts: A visual overview of valuation outputs and assumptions, designed for easy analysis of results.
Disclaimer
All information, articles, and product details provided on this website are for general informational and educational purposes only. We do not claim any ownership over, nor do we intend to infringe upon, any trademarks, copyrights, logos, brand names, or other intellectual property mentioned or depicted on this site. Such intellectual property remains the property of its respective owners, and any references here are made solely for identification or informational purposes, without implying any affiliation, endorsement, or partnership.
We make no representations or warranties, express or implied, regarding the accuracy, completeness, or suitability of any content or products presented. Nothing on this website should be construed as legal, tax, investment, financial, medical, or other professional advice. In addition, no part of this site—including articles or product references—constitutes a solicitation, recommendation, endorsement, advertisement, or offer to buy or sell any securities, franchises, or other financial instruments, particularly in jurisdictions where such activity would be unlawful.
All content is of a general nature and may not address the specific circumstances of any individual or entity. It is not a substitute for professional advice or services. Any actions you take based on the information provided here are strictly at your own risk. You accept full responsibility for any decisions or outcomes arising from your use of this website and agree to release us from any liability in connection with your use of, or reliance upon, the content or products found herein.