
|
Avaliação DCF da Surgery Partners, Inc. (SGRY) |
Totalmente Editável: Adapte-Se Às Suas Necessidades No Excel Ou Planilhas
Design Profissional: Modelos Confiáveis E Padrão Da Indústria
Pré-Construídos Para Uso Rápido E Eficiente
Compatível com MAC/PC, totalmente desbloqueado
Não É Necessária Experiência; Fácil De Seguir
Surgery Partners, Inc. (SGRY) Bundle
Simplifique sua análise e melhore a precisão com a nossa calculadora [SGRY] DCF! Alimentado pela Real Surgery Partners, Inc. Dados e suposições personalizáveis, essa ferramenta permite que você preveja, avalie e valorize parceiros de cirurgia como um investidor especializado.
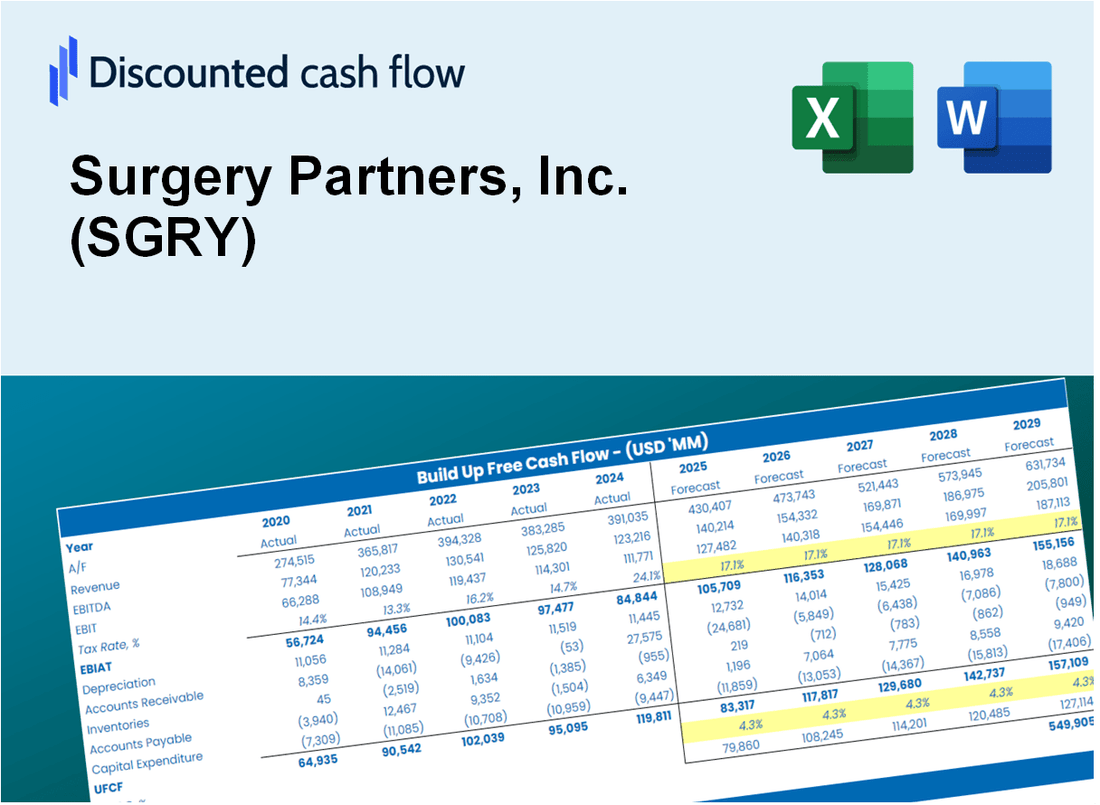
Discounted Cash Flow (DCF) - (USD MM)
| Year | AY1 2020 |
AY2 2021 |
AY3 2022 |
AY4 2023 |
AY5 2024 |
FY1 2025 |
FY2 2026 |
FY3 2027 |
FY4 2028 |
FY5 2029 |
|---|---|---|---|---|---|---|---|---|---|---|
| Revenue | 1,860.1 | 2,225.1 | 2,539.3 | 2,743.3 | 3,114.3 | 3,544.9 | 4,034.9 | 4,592.8 | 5,227.7 | 5,950.5 |
| Revenue Growth, % | 0 | 19.62 | 14.12 | 8.03 | 13.52 | 13.83 | 13.83 | 13.83 | 13.83 | 13.83 |
| EBITDA | 277.8 | 401.0 | 460.0 | 446.1 | 501.4 | 591.5 | 673.3 | 766.4 | 872.3 | 992.9 |
| EBITDA, % | 14.93 | 18.02 | 18.12 | 16.26 | 16.1 | 16.69 | 16.69 | 16.69 | 16.69 | 16.69 |
| Depreciation | 94.8 | 98.8 | 114.8 | 118.1 | 152.6 | 164.9 | 187.7 | 213.7 | 243.2 | 276.8 |
| Depreciation, % | 5.1 | 4.44 | 4.52 | 4.31 | 4.9 | 4.65 | 4.65 | 4.65 | 4.65 | 4.65 |
| EBIT | 183.0 | 302.2 | 345.2 | 328.0 | 348.8 | 426.6 | 485.6 | 552.7 | 629.1 | 716.1 |
| EBIT, % | 9.84 | 13.58 | 13.59 | 11.96 | 11.2 | 12.03 | 12.03 | 12.03 | 12.03 | 12.03 |
| Total Cash | 317.9 | 389.9 | 282.9 | 195.9 | 269.5 | 436.4 | 496.7 | 565.4 | 643.5 | 732.5 |
| Total Cash, percent | .0 | .0 | .0 | .0 | .0 | .0 | .0 | .0 | .0 | .0 |
| Account Receivables | 382.2 | 430.2 | 456.3 | 496.4 | 579.1 | 670.3 | 762.9 | 868.4 | 988.5 | 1,125.1 |
| Account Receivables, % | 20.55 | 19.33 | 17.97 | 18.09 | 18.59 | 18.91 | 18.91 | 18.91 | 18.91 | 18.91 |
| Inventories | 56.4 | 61.1 | 71.4 | 75.2 | 88.4 | 100.5 | 114.3 | 130.2 | 148.1 | 168.6 |
| Inventories, % | 3.03 | 2.75 | 2.81 | 2.74 | 2.84 | 2.83 | 2.83 | 2.83 | 2.83 | 2.83 |
| Accounts Payable | 100.2 | 124.9 | 151.6 | 171.8 | 208.7 | 212.2 | 241.6 | 275.0 | 313.0 | 356.2 |
| Accounts Payable, % | 5.39 | 5.61 | 5.97 | 6.26 | 6.7 | 5.99 | 5.99 | 5.99 | 5.99 | 5.99 |
| Capital Expenditure | -42.9 | -57.6 | -80.6 | -88.8 | -90.4 | -100.7 | -114.7 | -130.5 | -148.6 | -169.1 |
| Capital Expenditure, % | -2.31 | -2.59 | -3.17 | -3.24 | -2.9 | -2.84 | -2.84 | -2.84 | -2.84 | -2.84 |
| Tax Rate, % | 214.28 | 214.28 | 214.28 | 214.28 | 214.28 | 214.28 | 214.28 | 214.28 | 214.28 | 214.28 |
| EBITAT | 1,130.1 | -263.9 | -170.9 | -28.9 | -398.6 | 85.3 | 97.1 | 110.5 | 125.8 | 143.2 |
| Depreciation | ||||||||||
| Changes in Account Receivables | ||||||||||
| Changes in Inventories | ||||||||||
| Changes in Accounts Payable | ||||||||||
| Capital Expenditure | ||||||||||
| UFCF | 843.6 | -250.7 | -146.4 | -23.3 | -395.4 | 49.8 | 93.0 | 105.8 | 120.4 | 137.1 |
| WACC, % | 7.96 | 4.37 | 4.37 | 4.37 | 4.37 | 5.09 | 5.09 | 5.09 | 5.09 | 5.09 |
| PV UFCF | ||||||||||
| SUM PV UFCF | 428.5 | |||||||||
| Long Term Growth Rate, % | 3.50 | |||||||||
| Free cash flow (T + 1) | 142 | |||||||||
| Terminal Value | 8,923 | |||||||||
| Present Terminal Value | 6,962 | |||||||||
| Enterprise Value | 7,390 | |||||||||
| Net Debt | 3,434 | |||||||||
| Equity Value | 3,956 | |||||||||
| Diluted Shares Outstanding, MM | 126 | |||||||||
| Equity Value Per Share | 31.37 |
What You Will Get
- Real SGRY Financial Data: Pre-filled with Surgery Partners’ historical and projected data for precise analysis.
- Fully Editable Template: Modify key inputs like revenue growth, WACC, and EBITDA % with ease.
- Automatic Calculations: See Surgery Partners’ intrinsic value update instantly based on your changes.
- Professional Valuation Tool: Designed for investors, analysts, and consultants seeking accurate DCF results.
- User-Friendly Design: Simple structure and clear instructions for all experience levels.
Key Features
- Accurate Surgical Data: Access reliable pre-loaded historical performance metrics and future forecasts for Surgery Partners, Inc. (SGRY).
- Tailored Growth Assumptions: Modify highlighted cells for key variables such as revenue growth, operating margins, and capital expenditures.
- Real-Time Calculations: Instant updates to Discounted Cash Flow (DCF), Net Present Value (NPV), and profitability analysis.
- User-Friendly Dashboard: Intuitive charts and summaries to help visualize your financial assessments for Surgery Partners, Inc. (SGRY).
- Designed for All Levels: A straightforward, user-centric layout crafted for analysts, investors, and healthcare consultants.
How It Works
- Download: Obtain the pre-formatted Excel file containing Surgery Partners, Inc. (SGRY) financial data.
- Customize: Modify projections, including revenue growth, EBITDA margin, and discount rate.
- Update Automatically: The intrinsic value and net present value calculations refresh in real-time.
- Test Scenarios: Generate various forecasts and analyze results instantly.
- Make Decisions: Leverage the valuation insights to inform your investment choices.
Why Choose This Calculator for Surgery Partners, Inc. (SGRY)?
- Designed for Healthcare Professionals: A specialized tool tailored for analysts, CFOs, and healthcare consultants.
- Comprehensive Data: Surgery Partners' historical and projected financials are preloaded for precision.
- Flexible Scenario Analysis: Effortlessly simulate various forecasts and assumptions.
- Insightful Outputs: Automatically computes intrinsic value, NPV, and essential metrics.
- User-Friendly Interface: Step-by-step guidance ensures a smooth experience.
Who Should Use This Product?
- Healthcare Professionals: Understand surgical procedures and their financial implications using real-time data.
- Students in Healthcare Management: Integrate practical models into your studies or research projects.
- Investors: Evaluate your investment strategies and analyze the performance of Surgery Partners, Inc. (SGRY).
- Financial Analysts: Enhance your analysis with a customizable financial model tailored for the healthcare sector.
- Healthcare Administrators: Learn how large surgical organizations like Surgery Partners, Inc. (SGRY) are evaluated and managed.
What the Template Contains
- Historical Data: Includes Surgery Partners, Inc.'s (SGRY) past financials and baseline forecasts.
- DCF and Levered DCF Models: Detailed templates to calculate Surgery Partners, Inc.'s (SGRY) intrinsic value.
- WACC Sheet: Pre-built calculations for Weighted Average Cost of Capital.
- Editable Inputs: Modify key drivers like growth rates, EBITDA %, and CAPEX assumptions.
- Quarterly and Annual Statements: A complete breakdown of Surgery Partners, Inc.'s (SGRY) financials.
- Interactive Dashboard: Visualize valuation results and projections dynamically.
Disclaimer
All information, articles, and product details provided on this website are for general informational and educational purposes only. We do not claim any ownership over, nor do we intend to infringe upon, any trademarks, copyrights, logos, brand names, or other intellectual property mentioned or depicted on this site. Such intellectual property remains the property of its respective owners, and any references here are made solely for identification or informational purposes, without implying any affiliation, endorsement, or partnership.
We make no representations or warranties, express or implied, regarding the accuracy, completeness, or suitability of any content or products presented. Nothing on this website should be construed as legal, tax, investment, financial, medical, or other professional advice. In addition, no part of this site—including articles or product references—constitutes a solicitation, recommendation, endorsement, advertisement, or offer to buy or sell any securities, franchises, or other financial instruments, particularly in jurisdictions where such activity would be unlawful.
All content is of a general nature and may not address the specific circumstances of any individual or entity. It is not a substitute for professional advice or services. Any actions you take based on the information provided here are strictly at your own risk. You accept full responsibility for any decisions or outcomes arising from your use of this website and agree to release us from any liability in connection with your use of, or reliance upon, the content or products found herein.