
|
Avaliação DCF da empresa de telecomunicações Shenandoah (Shen) |
Totalmente Editável: Adapte-Se Às Suas Necessidades No Excel Ou Planilhas
Design Profissional: Modelos Confiáveis E Padrão Da Indústria
Pré-Construídos Para Uso Rápido E Eficiente
Compatível com MAC/PC, totalmente desbloqueado
Não É Necessária Experiência; Fácil De Seguir
Shenandoah Telecommunications Company (SHEN) Bundle
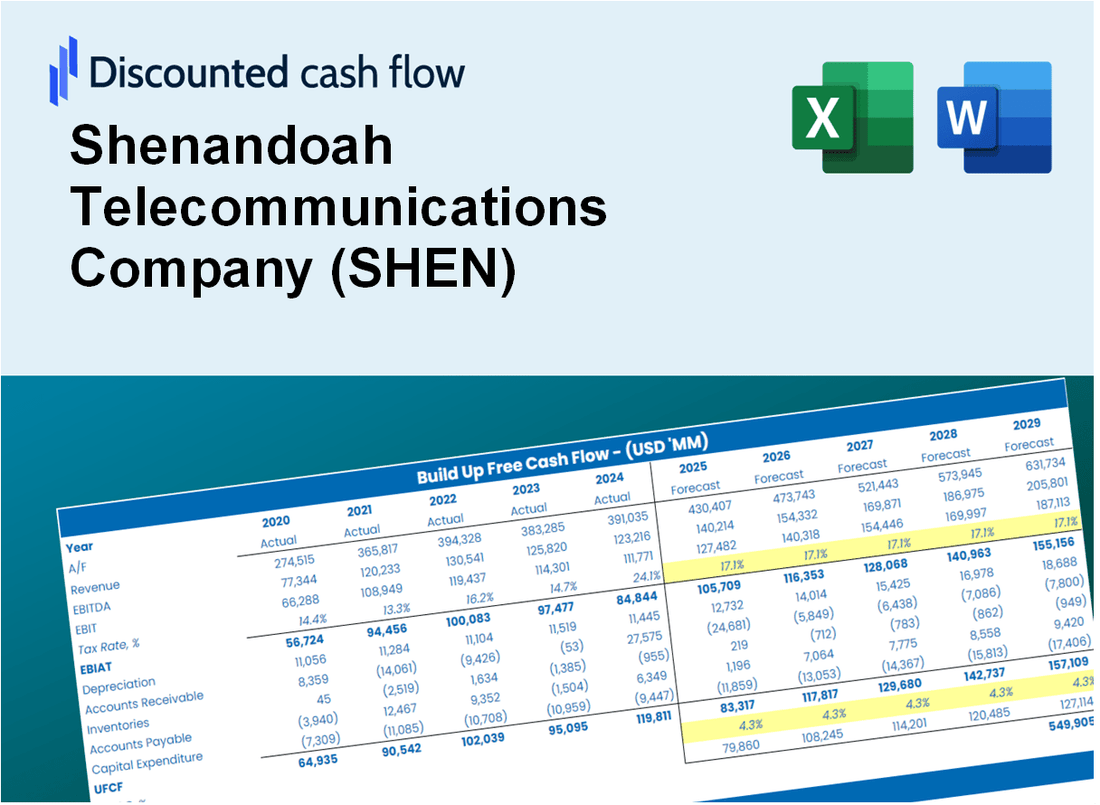
Simplifique a avaliação da Shenandoah Telecommunications Company (Shen) com esta calculadora DCF personalizável! Com a empresa de telecomunicações de Shenandoah Real (Shen) e entradas de previsão ajustável, você pode testar cenários e descobrir o valor justo da empresa de telecomunicações Shenandoah (Shen) em minutos.
What You Will Get
- Editable Forecast Inputs: Easily modify assumptions (growth %, margins, WACC) to explore various scenarios.
- Real-World Data: Shenandoah Telecommunications Company’s (SHEN) financial data pre-filled to kickstart your analysis.
- Automatic DCF Outputs: The template computes Net Present Value (NPV) and intrinsic value for you.
- Customizable and Professional: A refined Excel model that adjusts to your valuation requirements.
- Built for Analysts and Investors: Perfect for testing forecasts, validating strategies, and enhancing efficiency.
Key Features
- Accurate SHEN Financial Data: Gain access to reliable pre-loaded historical figures and future forecasts.
- Personalized Forecast Parameters: Modify highlighted cells for WACC, growth rates, and profit margins.
- Real-Time Calculations: Automatic updates to DCF, Net Present Value (NPV), and cash flow assessments.
- Interactive Dashboard: User-friendly charts and summaries to help you visualize your valuation findings.
- Designed for All Skill Levels: An easy-to-navigate format tailored for investors, CFOs, and consultants alike.
How It Works
- Download: Get the pre-prepared Excel file containing Shenandoah Telecommunications Company's (SHEN) financial data.
- Customize: Modify projections, such as revenue growth, EBITDA %, and WACC.
- Update Automatically: The intrinsic value and NPV calculations refresh in real-time.
- Test Scenarios: Develop various forecasts and compare results instantly.
- Make Decisions: Leverage the valuation outcomes to inform your investment strategy.
Why Choose This Calculator for Shenandoah Telecommunications Company (SHEN)?
- Designed for Industry Experts: A sophisticated tool utilized by financial analysts, CFOs, and telecom consultants.
- Accurate Financial Data: Historical and projected financials for Shenandoah Telecommunications preloaded for precision.
- Flexible Scenario Analysis: Effortlessly simulate various forecasts and assumptions.
- Comprehensive Outputs: Automatically computes intrinsic value, NPV, and essential financial metrics.
- User-Friendly Interface: Step-by-step guidance makes navigation simple and intuitive.
Who Should Use Shenandoah Telecommunications Company (SHEN)?
- Investors: Gain insights into the telecommunications sector with a reliable investment tool.
- Financial Analysts: Streamline your analysis with comprehensive data on SHEN's performance.
- Consultants: Tailor your findings for client presentations or strategic reports with ease.
- Telecom Enthusiasts: Enhance your knowledge of industry trends and company specifics through detailed resources.
- Educators and Students: Utilize SHEN as a case study in telecommunications courses to illustrate real-world applications.
What the Template Contains
- Comprehensive DCF Model: Editable template featuring detailed valuation calculations tailored for Shenandoah Telecommunications Company (SHEN).
- Real-World Data: Shenandoah Telecommunications Company’s historical and projected financials preloaded for thorough analysis.
- Customizable Parameters: Modify WACC, growth rates, and tax assumptions to explore various scenarios.
- Financial Statements: Complete annual and quarterly breakdowns for enhanced insights into performance.
- Key Ratios: Integrated analysis for assessing profitability, efficiency, and leverage metrics.
- Dashboard with Visual Outputs: Charts and tables designed for clear and actionable results.
Disclaimer
All information, articles, and product details provided on this website are for general informational and educational purposes only. We do not claim any ownership over, nor do we intend to infringe upon, any trademarks, copyrights, logos, brand names, or other intellectual property mentioned or depicted on this site. Such intellectual property remains the property of its respective owners, and any references here are made solely for identification or informational purposes, without implying any affiliation, endorsement, or partnership.
We make no representations or warranties, express or implied, regarding the accuracy, completeness, or suitability of any content or products presented. Nothing on this website should be construed as legal, tax, investment, financial, medical, or other professional advice. In addition, no part of this site—including articles or product references—constitutes a solicitation, recommendation, endorsement, advertisement, or offer to buy or sell any securities, franchises, or other financial instruments, particularly in jurisdictions where such activity would be unlawful.
All content is of a general nature and may not address the specific circumstances of any individual or entity. It is not a substitute for professional advice or services. Any actions you take based on the information provided here are strictly at your own risk. You accept full responsibility for any decisions or outcomes arising from your use of this website and agree to release us from any liability in connection with your use of, or reliance upon, the content or products found herein.