
|
Skipper Limited (Skipper.NS) Avaliação DCF |
Totalmente Editável: Adapte-Se Às Suas Necessidades No Excel Ou Planilhas
Design Profissional: Modelos Confiáveis E Padrão Da Indústria
Pré-Construídos Para Uso Rápido E Eficiente
Compatível com MAC/PC, totalmente desbloqueado
Não É Necessária Experiência; Fácil De Seguir
Skipper Limited (SKIPPER.NS) Bundle
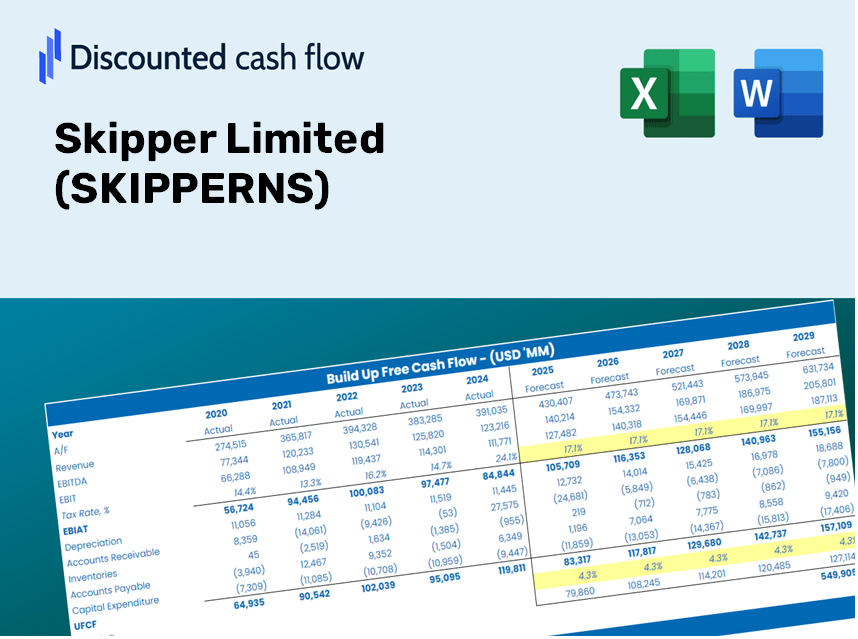
Explore o futuro financeiro da Skipper Limited (Skipherns) usando nossa calculadora DCF amigável! Digite suas projeções de crescimento, margens de lucro e despesas para determinar o valor intrínseco da Skipper Limited (Skipherns) e refine sua estratégia de investimento.
Discounted Cash Flow (DCF) - (USD MM)
| Year | AY1 2021 |
AY2 2022 |
AY3 2023 |
AY4 2024 |
AY5 2025 |
FY1 2026 |
FY2 2027 |
FY3 2028 |
FY4 2029 |
FY5 2030 |
|---|---|---|---|---|---|---|---|---|---|---|
| Revenue | 15,711.5 | 16,955.9 | 19,620.5 | 32,640.1 | 46,244.8 | 61,467.8 | 81,702.1 | 108,597.1 | 144,345.5 | 191,861.7 |
| Revenue Growth, % | 0 | 7.92 | 15.71 | 66.36 | 41.68 | 32.92 | 32.92 | 32.92 | 32.92 | 32.92 |
| EBITDA | 1,492.6 | 1,723.8 | 1,987.6 | 3,108.0 | 4,516.6 | 6,034.3 | 8,020.7 | 10,661.0 | 14,170.4 | 18,835.1 |
| EBITDA, % | 9.5 | 10.17 | 10.13 | 9.52 | 9.77 | 9.82 | 9.82 | 9.82 | 9.82 | 9.82 |
| Depreciation | 452.6 | 484.9 | 467.8 | 525.3 | 633.0 | 1,364.9 | 1,814.3 | 2,411.5 | 3,205.3 | 4,260.5 |
| Depreciation, % | 2.88 | 2.86 | 2.38 | 1.61 | 1.37 | 2.22 | 2.22 | 2.22 | 2.22 | 2.22 |
| EBIT | 1,040.0 | 1,238.8 | 1,519.8 | 2,582.7 | 3,883.6 | 4,669.4 | 6,206.5 | 8,249.5 | 10,965.1 | 14,574.7 |
| EBIT, % | 6.62 | 7.31 | 7.75 | 7.91 | 8.4 | 7.6 | 7.6 | 7.6 | 7.6 | 7.6 |
| Total Cash | 9.5 | 11.2 | 21.1 | 18.4 | 1,206.0 | 356.3 | 473.6 | 629.5 | 836.7 | 1,112.2 |
| Total Cash, percent | .0 | .0 | .0 | .0 | .0 | .0 | .0 | .0 | .0 | .0 |
| Account Receivables | 5,036.8 | 4,629.1 | 3,783.6 | 8,097.1 | 7,840.0 | 14,801.9 | 19,674.4 | 26,150.9 | 34,759.4 | 46,201.6 |
| Account Receivables, % | 32.06 | 27.3 | 19.28 | 24.81 | 16.95 | 24.08 | 24.08 | 24.08 | 24.08 | 24.08 |
| Inventories | 6,146.4 | 8,103.3 | 9,718.0 | 12,652.5 | 11,974.1 | 24,722.1 | 32,860.2 | 43,677.2 | 58,055.0 | 77,165.8 |
| Inventories, % | 39.12 | 47.79 | 49.53 | 38.76 | 25.89 | 40.22 | 40.22 | 40.22 | 40.22 | 40.22 |
| Accounts Payable | 6,573.3 | 6,264.3 | 5,881.2 | 12,217.8 | 12,217.8 | 21,219.7 | 28,204.9 | 37,489.4 | 49,830.3 | 66,233.7 |
| Accounts Payable, % | 41.84 | 36.94 | 29.97 | 37.43 | 26.42 | 34.52 | 34.52 | 34.52 | 34.52 | 34.52 |
| Capital Expenditure | -859.8 | -421.2 | -849.3 | -1,019.9 | -2,379.0 | -2,526.8 | -3,358.6 | -4,464.2 | -5,933.8 | -7,887.1 |
| Capital Expenditure, % | -5.47 | -2.48 | -4.33 | -3.12 | -5.14 | -4.11 | -4.11 | -4.11 | -4.11 | -4.11 |
| Tax Rate, % | 24.82 | 24.82 | 24.82 | 24.82 | 24.82 | 24.82 | 24.82 | 24.82 | 24.82 | 24.82 |
| EBITAT | 731.6 | 1,158.8 | 1,082.5 | 1,641.4 | 2,919.7 | 3,491.3 | 4,640.5 | 6,168.1 | 8,198.6 | 10,897.4 |
| Depreciation | ||||||||||
| Changes in Account Receivables | ||||||||||
| Changes in Inventories | ||||||||||
| Changes in Accounts Payable | ||||||||||
| Capital Expenditure | ||||||||||
| UFCF | -4,285.6 | -635.6 | -451.2 | 235.4 | 2,109.2 | -8,378.6 | -2,929.3 | -3,893.6 | -5,175.2 | -6,878.9 |
| WACC, % | 7.3 | 8.12 | 7.33 | 7.06 | 7.47 | 7.46 | 7.46 | 7.46 | 7.46 | 7.46 |
| PV UFCF | ||||||||||
| SUM PV UFCF | -22,154.8 | |||||||||
| Long Term Growth Rate, % | 2.00 | |||||||||
| Free cash flow (T + 1) | -7,016 | |||||||||
| Terminal Value | -128,591 | |||||||||
| Present Terminal Value | -89,753 | |||||||||
| Enterprise Value | -111,908 | |||||||||
| Net Debt | 6,190 | |||||||||
| Equity Value | -118,098 | |||||||||
| Diluted Shares Outstanding, MM | 108 | |||||||||
| Equity Value Per Share | -1,095.21 |
What You Will Receive
- Authentic SKIPPERNS Financial Data: Pre-loaded with Skipper Limited's historical and projected figures for accurate analysis.
- Completely Customizable Template: Easily adjust critical inputs such as revenue growth, WACC, and EBITDA percentage.
- Instantaneous Calculations: Witness real-time updates of Skipper Limited's intrinsic value as you make changes.
- Professional Valuation Tool: Tailored for investors, analysts, and consultants pursuing reliable DCF outcomes.
- User-Friendly Interface: Intuitive layout and straightforward instructions suitable for all experience levels.
Key Features
- Authentic SKIPPERNS Data: Pre-loaded with Skipper Limited's historical performance and future projections.
- Fully Customizable Parameters: Modify revenue growth rates, profit margins, discount rates, tax considerations, and capital spending.
- Dynamic Valuation Framework: Instant updates to Net Present Value (NPV) and intrinsic value based on your adjustments.
- Scenario Analysis: Develop various forecasting scenarios to evaluate different valuation possibilities.
- Intuitive Design: Easy to navigate, well-organized, and suitable for both experts and novices.
How It Operates
- Step 1: Download the Excel spreadsheet.
- Step 2: Examine Skipper Limited’s pre-filled financial information and projections.
- Step 3: Adjust key parameters such as revenue growth, WACC, and tax rates (highlighted cells).
- Step 4: Observe the DCF model refresh in real-time as you make changes to the assumptions.
- Step 5: Evaluate the results and utilize the findings for your investment strategies.
Why Choose the Skipper Limited (SKIPPERNS) Calculator?
- User-Friendly Interface: Perfect for both novice and seasoned users.
- Customizable Inputs: Adjust variables effortlessly to suit your analysis.
- Real-Time Updates: Instantly observe changes in Skipper Limited’s valuation as you input data.
- Preloaded Data: Comes with Skipper Limited’s actual financial information for immediate analysis.
- Valued by Experts: Trusted by analysts and investors for making well-informed choices.
Who Can Benefit from Skipper Limited (SKIPPERNS)?
- Investors: Make informed decisions with our top-tier valuation tools.
- Financial Analysts: Streamline your workflow with our customizable DCF model.
- Consultants: Effortlessly modify the template for client presentations or detailed reports.
- Finance Enthusiasts: Enhance your knowledge of valuation methods through practical examples.
- Educators and Students: Leverage this resource as an engaging learning tool in finance courses.
What the Template Includes
- Preloaded SKIPPERNS Data: Historical and forecasted financial metrics, such as revenue, EBIT, and capital expenditures.
- DCF and WACC Models: Advanced sheets designed for calculating intrinsic value and Weighted Average Cost of Capital.
- Editable Inputs: Yellow-highlighted fields for modifying revenue growth, tax rates, and discount rates.
- Financial Statements: Detailed annual and quarterly financial reports for thorough analysis.
- Key Ratios: Ratios for profitability, leverage, and efficiency to assess performance.
- Dashboard and Charts: Visual summaries of valuation results and assumptions.
Disclaimer
All information, articles, and product details provided on this website are for general informational and educational purposes only. We do not claim any ownership over, nor do we intend to infringe upon, any trademarks, copyrights, logos, brand names, or other intellectual property mentioned or depicted on this site. Such intellectual property remains the property of its respective owners, and any references here are made solely for identification or informational purposes, without implying any affiliation, endorsement, or partnership.
We make no representations or warranties, express or implied, regarding the accuracy, completeness, or suitability of any content or products presented. Nothing on this website should be construed as legal, tax, investment, financial, medical, or other professional advice. In addition, no part of this site—including articles or product references—constitutes a solicitation, recommendation, endorsement, advertisement, or offer to buy or sell any securities, franchises, or other financial instruments, particularly in jurisdictions where such activity would be unlawful.
All content is of a general nature and may not address the specific circumstances of any individual or entity. It is not a substitute for professional advice or services. Any actions you take based on the information provided here are strictly at your own risk. You accept full responsibility for any decisions or outcomes arising from your use of this website and agree to release us from any liability in connection with your use of, or reliance upon, the content or products found herein.