
|
Avaliação DCF Solid Power, Inc. (SLDP) |
Totalmente Editável: Adapte-Se Às Suas Necessidades No Excel Ou Planilhas
Design Profissional: Modelos Confiáveis E Padrão Da Indústria
Pré-Construídos Para Uso Rápido E Eficiente
Compatível com MAC/PC, totalmente desbloqueado
Não É Necessária Experiência; Fácil De Seguir
Solid Power, Inc. (SLDP) Bundle
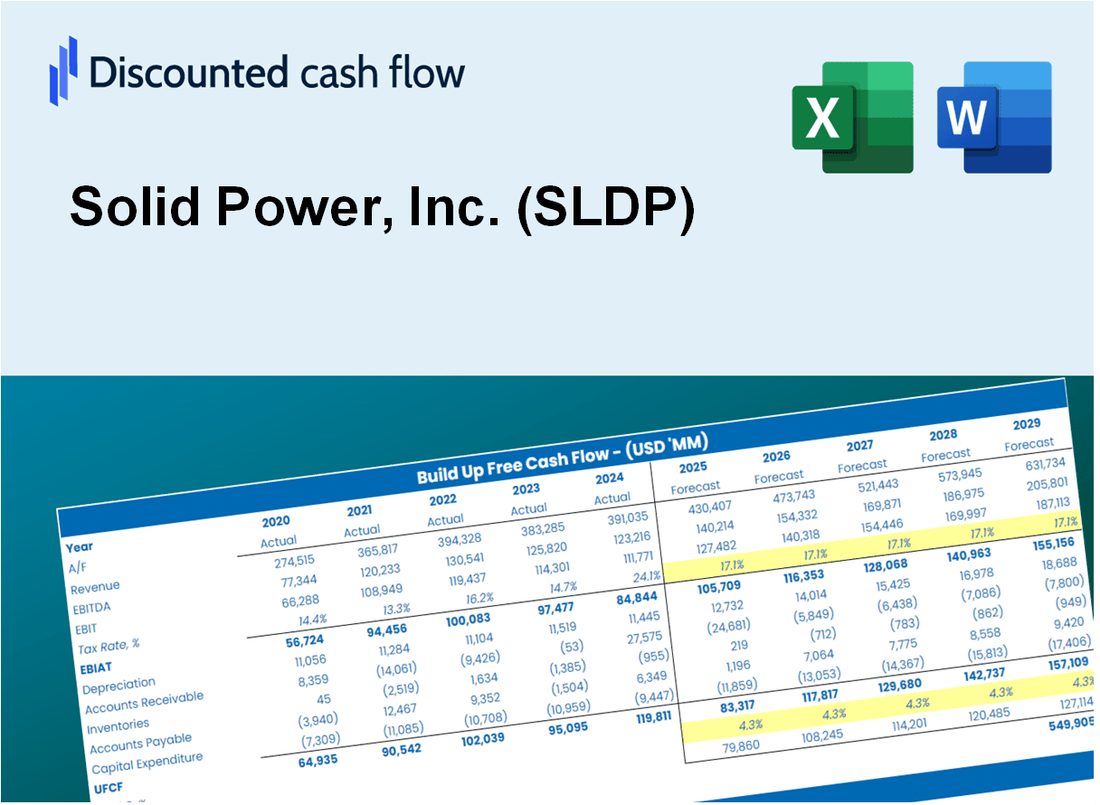
Obtenha informações sobre sua análise de avaliação Solid Power, Inc. (SLDP) usando nossa calculadora DCF de ponta! Este modelo do Excel é pré -carregado com dados reais do SLDP, permitindo que você ajuste as previsões e suposições para determinar com precisão o valor intrínseco do Solid Power, Inc.
What You Will Get
- Real Solid Power Data: Preloaded financials – encompassing revenue to EBIT – based on actual and projected figures.
- Full Customization: Modify all essential parameters (yellow cells) such as WACC, growth %, and tax rates.
- Instant Valuation Updates: Automatic recalculations to evaluate the effects of changes on Solid Power’s fair value.
- Versatile Excel Template: Designed for quick edits, scenario testing, and comprehensive projections.
- Time-Saving and Accurate: Avoid the hassle of building models from the ground up while ensuring precision and adaptability.
Key Features
- Real-Life SLDP Data: Pre-filled with Solid Power's historical financials and forward-looking projections.
- Fully Customizable Inputs: Adjust revenue growth, margins, WACC, tax rates, and capital expenditures to fit your analysis.
- Dynamic Valuation Model: Automatic updates to Net Present Value (NPV) and intrinsic value based on your customized inputs.
- Scenario Testing: Create multiple forecast scenarios to evaluate various valuation outcomes.
- User-Friendly Design: Intuitive, structured layout designed for both professionals and newcomers.
How It Works
- Step 1: Download the Excel file for Solid Power, Inc. (SLDP).
- Step 2: Review pre-entered Solid Power data (historical and projected).
- Step 3: Adjust key assumptions (yellow cells) based on your analysis.
- Step 4: View automatic recalculations for Solid Power’s intrinsic value.
- Step 5: Use the outputs for investment decisions or reporting.
Why Choose This Calculator for Solid Power, Inc. (SLDP)?
- Accuracy: Utilizes real Solid Power financials to ensure precise data.
- Flexibility: Built for users to easily test and adjust inputs as needed.
- Time-Saving: Avoid the complexity of creating a DCF model from the ground up.
- Professional-Grade: Crafted with the accuracy and usability expected at the CFO level.
- User-Friendly: Intuitive design makes it accessible for users without advanced financial modeling skills.
Who Should Use This Product?
- Investors: Accurately estimate Solid Power, Inc.’s (SLDP) fair value before making investment decisions.
- CFOs: Utilize a professional-grade DCF model for financial reporting and analysis specific to Solid Power, Inc. (SLDP).
- Consultants: Quickly customize the template for valuation reports tailored to Solid Power, Inc. (SLDP) clients.
- Entrepreneurs: Gain insights into financial modeling practices employed by leading companies in the battery technology sector.
- Educators: Use it as a teaching tool to demonstrate valuation methodologies relevant to the energy and technology industries.
What the Template Contains
- Preloaded SLDP Data: Historical and projected financial data, including revenue, EBIT, and capital expenditures.
- DCF and WACC Models: Professional-grade sheets for calculating intrinsic value and Weighted Average Cost of Capital.
- Editable Inputs: Yellow-highlighted cells for adjusting revenue growth, tax rates, and discount rates.
- Financial Statements: Comprehensive annual and quarterly financials for deeper analysis.
- Key Ratios: Profitability, leverage, and efficiency ratios to evaluate performance.
- Dashboard and Charts: Visual summaries of valuation outcomes and assumptions.
Disclaimer
All information, articles, and product details provided on this website are for general informational and educational purposes only. We do not claim any ownership over, nor do we intend to infringe upon, any trademarks, copyrights, logos, brand names, or other intellectual property mentioned or depicted on this site. Such intellectual property remains the property of its respective owners, and any references here are made solely for identification or informational purposes, without implying any affiliation, endorsement, or partnership.
We make no representations or warranties, express or implied, regarding the accuracy, completeness, or suitability of any content or products presented. Nothing on this website should be construed as legal, tax, investment, financial, medical, or other professional advice. In addition, no part of this site—including articles or product references—constitutes a solicitation, recommendation, endorsement, advertisement, or offer to buy or sell any securities, franchises, or other financial instruments, particularly in jurisdictions where such activity would be unlawful.
All content is of a general nature and may not address the specific circumstances of any individual or entity. It is not a substitute for professional advice or services. Any actions you take based on the information provided here are strictly at your own risk. You accept full responsibility for any decisions or outcomes arising from your use of this website and agree to release us from any liability in connection with your use of, or reliance upon, the content or products found herein.