
|
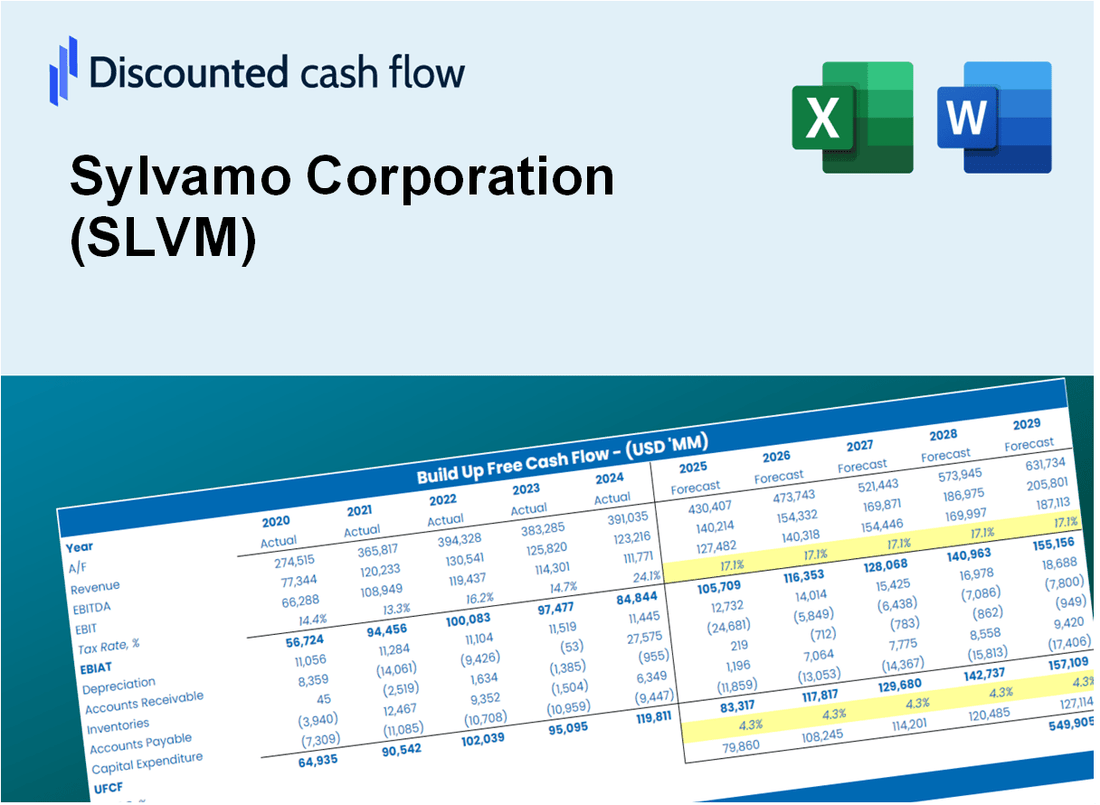
Avaliação DCF Sylvamo Corporation (SLVM) |
Totalmente Editável: Adapte-Se Às Suas Necessidades No Excel Ou Planilhas
Design Profissional: Modelos Confiáveis E Padrão Da Indústria
Pré-Construídos Para Uso Rápido E Eficiente
Compatível com MAC/PC, totalmente desbloqueado
Não É Necessária Experiência; Fácil De Seguir
Sylvamo Corporation (SLVM) Bundle
Otimize seu tempo e melhore a precisão com a calculadora DCF da Sylvamo Corporation (SLVM)! Utilizando dados reais de Sylvamo e suposições personalizáveis, essa ferramenta o capacita a prever, analisar e valorizar a Sylvamo Corporation (SLVM) como um investidor experiente.
Discounted Cash Flow (DCF) - (USD MM)
| Year | AY1 2020 |
AY2 2021 |
AY3 2022 |
AY4 2023 |
AY5 2024 |
FY1 2025 |
FY2 2026 |
FY3 2027 |
FY4 2028 |
FY5 2029 |
|---|---|---|---|---|---|---|---|---|---|---|
| Revenue | 2,385.0 | 2,828.0 | 3,628.0 | 3,721.0 | 3,773.0 | 4,252.4 | 4,792.7 | 5,401.7 | 6,088.0 | 6,861.5 |
| Revenue Growth, % | 0 | 18.57 | 28.29 | 2.56 | 1.4 | 12.71 | 12.71 | 12.71 | 12.71 | 12.71 |
| EBITDA | 234.0 | 485.0 | 645.0 | 572.0 | 617.0 | 650.3 | 732.9 | 826.1 | 931.0 | 1,049.3 |
| EBITDA, % | 9.81 | 17.15 | 17.78 | 15.37 | 16.35 | 15.29 | 15.29 | 15.29 | 15.29 | 15.29 |
| Depreciation | 135.0 | 126.0 | 106.0 | 143.0 | 159.0 | 179.4 | 202.2 | 227.9 | 256.8 | 289.5 |
| Depreciation, % | 5.66 | 4.46 | 2.92 | 3.84 | 4.21 | 4.22 | 4.22 | 4.22 | 4.22 | 4.22 |
| EBIT | 99.0 | 359.0 | 539.0 | 429.0 | 458.0 | 470.9 | 530.7 | 598.2 | 674.2 | 759.8 |
| EBIT, % | 4.15 | 12.69 | 14.86 | 11.53 | 12.14 | 11.07 | 11.07 | 11.07 | 11.07 | 11.07 |
| Total Cash | 95.0 | 159.0 | 360.0 | 220.0 | 205.0 | 262.6 | 295.9 | 333.5 | 375.9 | 423.7 |
| Total Cash, percent | .0 | .0 | .0 | .0 | .0 | .0 | .0 | .0 | .0 | .0 |
| Account Receivables | 621.0 | 428.0 | 480.0 | 455.0 | 455.0 | 669.2 | 754.3 | 850.1 | 958.1 | 1,079.9 |
| Account Receivables, % | 26.04 | 15.13 | 13.23 | 12.23 | 12.06 | 15.74 | 15.74 | 15.74 | 15.74 | 15.74 |
| Inventories | 342.0 | 279.0 | 364.0 | 404.0 | 361.0 | 464.9 | 524.0 | 590.5 | 665.6 | 750.2 |
| Inventories, % | 14.34 | 9.87 | 10.03 | 10.86 | 9.57 | 10.93 | 10.93 | 10.93 | 10.93 | 10.93 |
| Accounts Payable | 259.0 | 387.0 | 453.0 | 421.0 | 375.0 | 495.7 | 558.7 | 629.7 | 709.7 | 799.8 |
| Accounts Payable, % | 10.86 | 13.68 | 12.49 | 11.31 | 9.94 | 11.66 | 11.66 | 11.66 | 11.66 | 11.66 |
| Capital Expenditure | -75.0 | -69.0 | -149.0 | -210.0 | -221.0 | -180.2 | -203.1 | -228.9 | -258.0 | -290.8 |
| Capital Expenditure, % | -3.14 | -2.44 | -4.11 | -5.64 | -5.86 | -4.24 | -4.24 | -4.24 | -4.24 | -4.24 |
| Tax Rate, % | 25.43 | 25.43 | 25.43 | 25.43 | 25.43 | 25.43 | 25.43 | 25.43 | 25.43 | 25.43 |
| EBITAT | 177.2 | 362.3 | 136.2 | 294.1 | 341.5 | 347.0 | 391.1 | 440.7 | 496.7 | 559.9 |
| Depreciation | ||||||||||
| Changes in Account Receivables | ||||||||||
| Changes in Inventories | ||||||||||
| Changes in Accounts Payable | ||||||||||
| Capital Expenditure | ||||||||||
| UFCF | -466.8 | 803.3 | 22.2 | 180.1 | 276.5 | 148.7 | 309.0 | 348.3 | 392.5 | 442.4 |
| WACC, % | 7.4 | 7.4 | 5.92 | 6.78 | 6.89 | 6.88 | 6.88 | 6.88 | 6.88 | 6.88 |
| PV UFCF | ||||||||||
| SUM PV UFCF | 1,313.0 | |||||||||
| Long Term Growth Rate, % | 0.50 | |||||||||
| Free cash flow (T + 1) | 445 | |||||||||
| Terminal Value | 6,973 | |||||||||
| Present Terminal Value | 5,000 | |||||||||
| Enterprise Value | 6,313 | |||||||||
| Net Debt | 599 | |||||||||
| Equity Value | 5,714 | |||||||||
| Diluted Shares Outstanding, MM | 42 | |||||||||
| Equity Value Per Share | 136.06 |
What You Will Receive
- Authentic SLVM Financial Data: Pre-loaded with Sylvamo’s historical and forecasted data for accurate analysis.
- Completely Customizable Template: Easily adjust key inputs such as revenue growth, WACC, and EBITDA percentage.
- Instant Calculations: Watch Sylvamo’s intrinsic value refresh immediately based on your modifications.
- Expert Valuation Tool: Tailored for investors, analysts, and consultants aiming for precise DCF outcomes.
- Intuitive Design: Clear layout and straightforward instructions suitable for all skill levels.
Key Features
- Comprehensive Data: Sylvamo Corporation’s historical financial statements and pre-filled projections.
- Customizable Inputs: Modify WACC, tax rates, revenue growth, and EBITDA margins as needed.
- Real-Time Results: View Sylvamo’s intrinsic value recalculating instantly.
- Intuitive Visual Outputs: Dashboard charts illustrate valuation results and essential metrics.
- Designed for Precision: A professional-grade tool for analysts, investors, and finance professionals.
How It Works
- 1. Access the Template: Download and open the Excel file containing Sylvamo Corporation's (SLVM) preloaded data.
- 2. Modify Assumptions: Adjust key variables such as growth rates, WACC, and capital expenditures.
- 3. View Results Instantly: The DCF model automatically computes the intrinsic value and NPV.
- 4. Explore Scenarios: Analyze various forecasts to evaluate different valuation outcomes.
- 5. Present with Confidence: Share professional valuation insights to enhance your decision-making.
Why Choose This Calculator for Sylvamo Corporation (SLVM)?
- Precision: Utilizes real Sylvamo financial data to guarantee accuracy.
- Adaptability: Built for users to easily adjust and experiment with inputs.
- Efficiency: Avoid the complexities of creating a DCF model from the ground up.
- Expert-Level: Crafted with the precision and usability expected at the CFO level.
- Intuitive: Simple to navigate, even for those lacking advanced financial modeling skills.
Who Should Use This Product?
- Finance Students: Master valuation techniques and apply them using real-world data for Sylvamo Corporation (SLVM).
- Academics: Integrate professional models into your coursework or research focused on Sylvamo Corporation (SLVM).
- Investors: Validate your assumptions and analyze valuation outcomes for Sylvamo Corporation (SLVM) stock.
- Analysts: Enhance your productivity with a customizable DCF model specifically designed for Sylvamo Corporation (SLVM).
- Small Business Owners: Discover how large public companies like Sylvamo Corporation (SLVM) are evaluated and analyzed.
What the Template Contains
- Preloaded SLVM Data: Historical and projected financial data, including revenue, EBIT, and capital expenditures.
- DCF and WACC Models: Professional-grade sheets for calculating intrinsic value and Weighted Average Cost of Capital.
- Editable Inputs: Yellow-highlighted cells for adjusting revenue growth, tax rates, and discount rates.
- Financial Statements: Comprehensive annual and quarterly financials for deeper analysis.
- Key Ratios: Profitability, leverage, and efficiency ratios to evaluate performance.
- Dashboard and Charts: Visual summaries of valuation outcomes and assumptions.
Disclaimer
All information, articles, and product details provided on this website are for general informational and educational purposes only. We do not claim any ownership over, nor do we intend to infringe upon, any trademarks, copyrights, logos, brand names, or other intellectual property mentioned or depicted on this site. Such intellectual property remains the property of its respective owners, and any references here are made solely for identification or informational purposes, without implying any affiliation, endorsement, or partnership.
We make no representations or warranties, express or implied, regarding the accuracy, completeness, or suitability of any content or products presented. Nothing on this website should be construed as legal, tax, investment, financial, medical, or other professional advice. In addition, no part of this site—including articles or product references—constitutes a solicitation, recommendation, endorsement, advertisement, or offer to buy or sell any securities, franchises, or other financial instruments, particularly in jurisdictions where such activity would be unlawful.
All content is of a general nature and may not address the specific circumstances of any individual or entity. It is not a substitute for professional advice or services. Any actions you take based on the information provided here are strictly at your own risk. You accept full responsibility for any decisions or outcomes arising from your use of this website and agree to release us from any liability in connection with your use of, or reliance upon, the content or products found herein.