
|
Sharkninja, Inc. (SN) DCF Avaliação |
Totalmente Editável: Adapte-Se Às Suas Necessidades No Excel Ou Planilhas
Design Profissional: Modelos Confiáveis E Padrão Da Indústria
Pré-Construídos Para Uso Rápido E Eficiente
Compatível com MAC/PC, totalmente desbloqueado
Não É Necessária Experiência; Fácil De Seguir
SharkNinja, Inc. (SN) Bundle
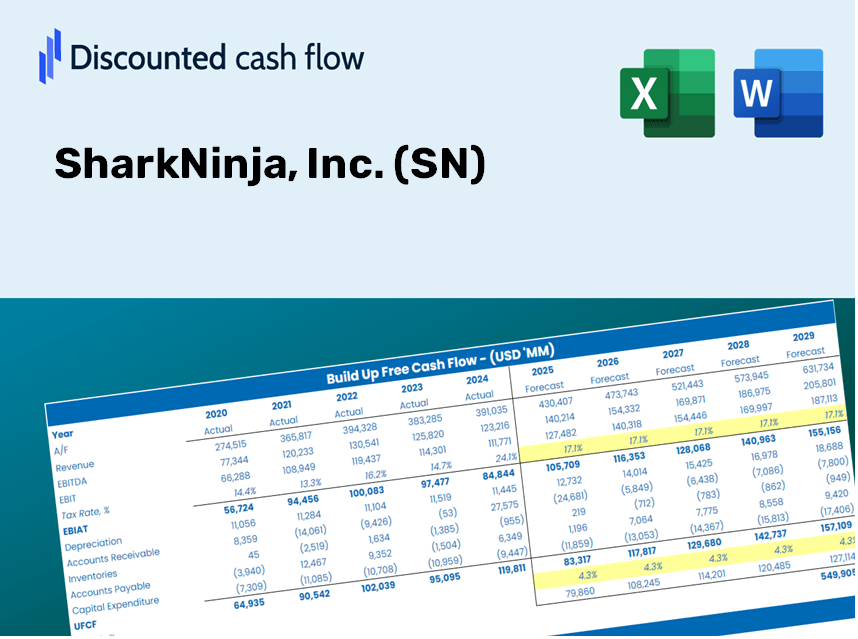
Explore Sharkninja, Inc. (SN) FUTURO FINANCEIRO COM AS CALLUGULAÇÃO DCF DCF! Digite suas suposições de crescimento, margens e custos para calcular o valor intrínseco Sharkninja, Inc. (SN) e aprimorar sua estratégia de investimento.
Discounted Cash Flow (DCF) - (USD MM)
| Year | AY1 2020 |
AY2 2021 |
AY3 2022 |
AY4 2023 |
AY5 2024 |
FY1 2025 |
FY2 2026 |
FY3 2027 |
FY4 2028 |
FY5 2029 |
|---|---|---|---|---|---|---|---|---|---|---|
| Revenue | 2,753.2 | 3,727.0 | 3,717.4 | 4,253.7 | 5,528.6 | 6,627.6 | 7,945.1 | 9,524.4 | 11,417.7 | 13,687.4 |
| Revenue Growth, % | 0 | 35.37 | -0.25833 | 14.43 | 29.97 | 19.88 | 19.88 | 19.88 | 19.88 | 19.88 |
| EBITDA | 537.8 | 508.8 | 415.7 | 442.0 | 759.3 | 907.9 | 1,088.4 | 1,304.7 | 1,564.1 | 1,875.0 |
| EBITDA, % | 19.53 | 13.65 | 11.18 | 10.39 | 13.73 | 13.7 | 13.7 | 13.7 | 13.7 | 13.7 |
| Depreciation | 78.1 | 78.2 | 86.7 | 103.8 | 123.1 | 158.2 | 189.6 | 227.3 | 272.5 | 326.7 |
| Depreciation, % | 2.84 | 2.1 | 2.33 | 2.44 | 2.23 | 2.39 | 2.39 | 2.39 | 2.39 | 2.39 |
| EBIT | 459.7 | 430.6 | 329.0 | 338.1 | 636.2 | 749.7 | 898.7 | 1,077.4 | 1,291.6 | 1,548.3 |
| EBIT, % | 16.7 | 11.55 | 8.85 | 7.95 | 11.51 | 11.31 | 11.31 | 11.31 | 11.31 | 11.31 |
| Total Cash | 225.4 | 192.9 | 154.1 | 363.7 | ||||||
| Total Cash, percent | .0 | .0 | .0 | .0 | ||||||
| Account Receivables | 906.0 | 839.4 | 985.2 | 1,266.6 | ||||||
| Account Receivables, % | 24.31 | 22.58 | 23.16 | 22.91 | ||||||
| Inventories | 602.5 | 548.6 | 699.7 | 900.0 | ||||||
| Inventories, % | 16.17 | 14.76 | 16.45 | 16.28 | ||||||
| Accounts Payable | 442.6 | 328.1 | 459.7 | 612.0 | ||||||
| Accounts Payable, % | 11.87 | 8.83 | 10.81 | 11.07 | ||||||
| Capital Expenditure | -61.1 | -60.1 | -94.4 | -131.8 | -151.2 | -161.8 | -193.9 | -232.5 | -278.7 | -334.1 |
| Capital Expenditure, % | -2.22 | -1.61 | -2.54 | -3.1 | -2.73 | -2.44 | -2.44 | -2.44 | -2.44 | -2.44 |
| Tax Rate, % | 23.37 | 23.37 | 23.37 | 23.37 | 23.37 | 23.37 | 23.37 | 23.37 | 23.37 | 23.37 |
| EBITAT | 358.6 | 344.1 | 253.1 | 192.7 | 487.5 | 552.5 | 662.3 | 794.0 | 951.8 | 1,141.0 |
| Depreciation | ||||||||||
| Changes in Account Receivables | ||||||||||
| Changes in Inventories | ||||||||||
| Changes in Accounts Payable | ||||||||||
| Capital Expenditure | ||||||||||
| UFCF | 375.6 | -703.6 | 251.4 | -.7 | 130.2 | 2,103.5 | 658.0 | 788.8 | 945.7 | 1,133.6 |
| WACC, % | 10.44 | 10.45 | 10.44 | 10.34 | 10.43 | 10.42 | 10.42 | 10.42 | 10.42 | 10.42 |
| PV UFCF | ||||||||||
| SUM PV UFCF | 4,357.3 | |||||||||
| Long Term Growth Rate, % | 2.00 | |||||||||
| Free cash flow (T + 1) | 1,156 | |||||||||
| Terminal Value | 13,733 | |||||||||
| Present Terminal Value | 8,366 | |||||||||
| Enterprise Value | 12,723 | |||||||||
| Net Debt | 575 | |||||||||
| Equity Value | 12,148 | |||||||||
| Diluted Shares Outstanding, MM | 141 | |||||||||
| Equity Value Per Share | 86.10 |
What You Will Receive
- Customizable Excel Template: A fully adjustable Excel-based DCF Calculator featuring pre-filled real SharkNinja, Inc. (SN) financials.
- Authentic Data: Historical performance data along with forward-looking estimates (highlighted in the yellow cells).
- Flexible Forecasting: Modify key assumptions such as revenue growth, EBITDA %, and WACC at your convenience.
- Instant Calculations: Quickly observe how your inputs affect the valuation of SharkNinja, Inc. (SN).
- Professional Resource: Designed for investors, CFOs, consultants, and financial analysts.
- User-Centric Interface: Organized for simplicity and usability, complete with step-by-step guidance.
Key Features
- Authentic SharkNinja Financials: Gain access to reliable pre-loaded historical data and future forecasts.
- Adjustable Forecast Parameters: Modify highlighted cells for key metrics such as WACC, growth rates, and profit margins.
- Real-Time Calculations: Automatic updates for DCF, Net Present Value (NPV), and cash flow analysis.
- Interactive Dashboard: User-friendly charts and summaries to help you visualize valuation outcomes.
- Designed for All Skill Levels: An intuitive layout tailored for investors, CFOs, and consultants alike.
How It Works
- Step 1: Download the ready-made Excel template that includes SharkNinja, Inc. (SN) data.
- Step 2: Navigate through the pre-populated sheets to comprehend the essential metrics.
- Step 3: Modify forecasts and assumptions in the editable yellow cells (WACC, growth, margins).
- Step 4: Instantly see the updated results, which include SharkNinja, Inc. (SN)'s intrinsic value.
- Step 5: Use the outputs to make informed investment choices or create comprehensive reports.
Why Choose This Calculator for SharkNinja, Inc. (SN)?
- Precision: Utilizes real SharkNinja financial data to ensure reliable results.
- Adaptability: Built to allow users to easily test and adjust inputs as needed.
- Efficiency: Avoid the complexities of creating a DCF model from the ground up.
- Expert Quality: Crafted with the insight and accuracy expected at the CFO level.
- Intuitive Design: Simple enough for anyone, regardless of their financial modeling background.
Who Should Consider Using This Product?
- Individual Investors: Gain insights to make informed choices about buying or selling SharkNinja, Inc. (SN) shares.
- Financial Analysts: Enhance valuation methodologies with user-friendly financial models tailored for SharkNinja, Inc. (SN).
- Consultants: Provide clients with swift and accurate valuation analyses for SharkNinja, Inc. (SN).
- Business Owners: Learn how leading companies like SharkNinja, Inc. (SN) are valued to refine your strategic approach.
- Finance Students: Practice valuation techniques with real-world data linked to SharkNinja, Inc. (SN).
Contents of the Template
- Pre-Filled DCF Model: SharkNinja’s financial data preloaded for immediate analysis.
- WACC Calculator: Comprehensive calculations for Weighted Average Cost of Capital.
- Financial Ratios: Assess SharkNinja’s profitability, leverage, and operational efficiency.
- Editable Inputs: Adjust assumptions such as growth rates, margins, and CAPEX to suit your analyses.
- Financial Statements: Access annual and quarterly reports for in-depth evaluation.
- Interactive Dashboard: Visualize key valuation metrics and outcomes with ease.
Disclaimer
All information, articles, and product details provided on this website are for general informational and educational purposes only. We do not claim any ownership over, nor do we intend to infringe upon, any trademarks, copyrights, logos, brand names, or other intellectual property mentioned or depicted on this site. Such intellectual property remains the property of its respective owners, and any references here are made solely for identification or informational purposes, without implying any affiliation, endorsement, or partnership.
We make no representations or warranties, express or implied, regarding the accuracy, completeness, or suitability of any content or products presented. Nothing on this website should be construed as legal, tax, investment, financial, medical, or other professional advice. In addition, no part of this site—including articles or product references—constitutes a solicitation, recommendation, endorsement, advertisement, or offer to buy or sell any securities, franchises, or other financial instruments, particularly in jurisdictions where such activity would be unlawful.
All content is of a general nature and may not address the specific circumstances of any individual or entity. It is not a substitute for professional advice or services. Any actions you take based on the information provided here are strictly at your own risk. You accept full responsibility for any decisions or outcomes arising from your use of this website and agree to release us from any liability in connection with your use of, or reliance upon, the content or products found herein.