
|
Avaliação do DCF Senestech, Inc. (SNES) |
Totalmente Editável: Adapte-Se Às Suas Necessidades No Excel Ou Planilhas
Design Profissional: Modelos Confiáveis E Padrão Da Indústria
Pré-Construídos Para Uso Rápido E Eficiente
Compatível com MAC/PC, totalmente desbloqueado
Não É Necessária Experiência; Fácil De Seguir
SenesTech, Inc. (SNES) Bundle
Simplifique a avaliação SeneStech, Inc. (SNES) com esta calculadora DCF personalizável! Apresentando o Real Senestech, Inc. (SNES) financeiras e insumos de previsão ajustáveis, você pode testar cenários e descobrir o valor justo da Senestech, Inc. (SNES) em minutos.
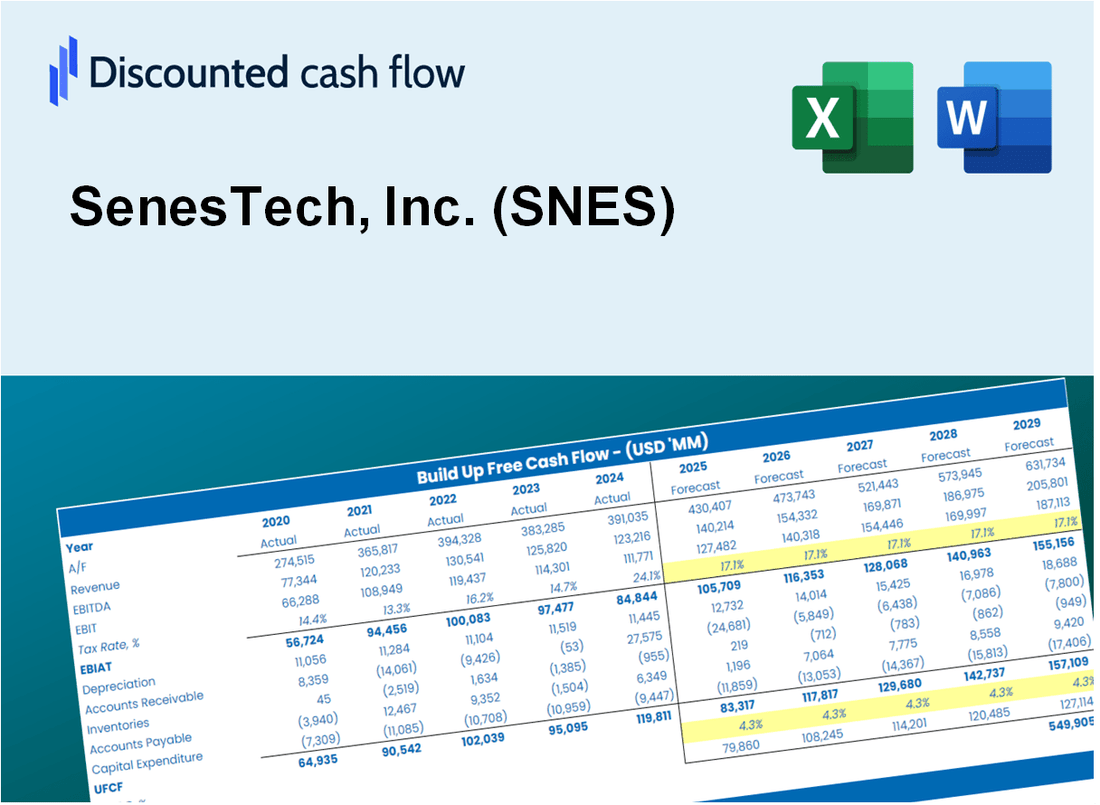
Discounted Cash Flow (DCF) - (USD MM)
| Year | AY1 2020 |
AY2 2021 |
AY3 2022 |
AY4 2023 |
AY5 2024 |
FY1 2025 |
FY2 2026 |
FY3 2027 |
FY4 2028 |
FY5 2029 |
|---|---|---|---|---|---|---|---|---|---|---|
| Revenue | .3 | .6 | 1.0 | 1.2 | 1.9 | 3.0 | 4.9 | 8.0 | 12.9 | 21.0 |
| Revenue Growth, % | 0 | 123.26 | 76.91 | 17.08 | 55.66 | 62.41 | 62.41 | 62.41 | 62.41 | 62.41 |
| EBITDA | -7.6 | -8.0 | -9.5 | -7.6 | -6.0 | -3.0 | -4.9 | -8.0 | -12.9 | -21.0 |
| EBITDA, % | -2953.88 | -1380.9 | -933.27 | -634.62 | -323.42 | -100 | -100 | -100 | -100 | -100 |
| Depreciation | .3 | .3 | .2 | .1 | .2 | 1.1 | 1.9 | 3.0 | 4.9 | 8.0 |
| Depreciation, % | 111.63 | 52.6 | 17.96 | 11.32 | 8.4 | 38.06 | 38.06 | 38.06 | 38.06 | 38.06 |
| EBIT | -7.9 | -8.3 | -9.7 | -7.7 | -6.2 | -3.0 | -4.9 | -8.0 | -12.9 | -21.0 |
| EBIT, % | -3065.5 | -1433.51 | -951.23 | -645.93 | -331.83 | -100 | -100 | -100 | -100 | -100 |
| Total Cash | 3.6 | 9.3 | 4.8 | 5.4 | 1.3 | 2.8 | 4.6 | 7.5 | 12.2 | 19.7 |
| Total Cash, percent | .0 | .0 | .0 | .0 | .0 | .0 | .0 | .0 | .0 | .0 |
| Account Receivables | .0 | .1 | .1 | .1 | .3 | .4 | .6 | 1.0 | 1.6 | 2.5 |
| Account Receivables, % | 9.69 | 13.37 | 11.09 | 7.96 | 18.04 | 12.03 | 12.03 | 12.03 | 12.03 | 12.03 |
| Inventories | .9 | 1.0 | .9 | .8 | .8 | 2.4 | 3.9 | 6.3 | 10.2 | 16.5 |
| Inventories, % | 366.28 | 173.78 | 83.71 | 66.64 | 42.76 | 78.62 | 78.62 | 78.62 | 78.62 | 78.62 |
| Accounts Payable | .4 | .3 | .5 | .2 | .2 | 1.4 | 2.3 | 3.7 | 6.1 | 9.9 |
| Accounts Payable, % | 156.59 | 57.81 | 52.99 | 12.57 | 11.58 | 46.99 | 46.99 | 46.99 | 46.99 | 46.99 |
| Capital Expenditure | -.1 | -.1 | -.2 | -.1 | -.1 | -.6 | -.9 | -1.5 | -2.5 | -4.0 |
| Capital Expenditure, % | -44.19 | -17.36 | -17.08 | -12.49 | -4.52 | -19.13 | -19.13 | -19.13 | -19.13 | -19.13 |
| Tax Rate, % | 0 | 0 | 0 | 0 | 0 | 0 | 0 | 0 | 0 | 0 |
| EBITAT | -7.9 | -8.3 | -9.7 | -7.7 | -6.2 | -3.0 | -4.9 | -8.0 | -12.9 | -21.0 |
| Depreciation | ||||||||||
| Changes in Account Receivables | ||||||||||
| Changes in Inventories | ||||||||||
| Changes in Accounts Payable | ||||||||||
| Capital Expenditure | ||||||||||
| UFCF | -8.3 | -8.2 | -9.4 | -8.0 | -6.3 | -2.8 | -4.8 | -7.8 | -12.6 | -20.5 |
| WACC, % | 5.17 | 5.17 | 5.17 | 5.17 | 5.17 | 5.17 | 5.17 | 5.17 | 5.17 | 5.17 |
| PV UFCF | ||||||||||
| SUM PV UFCF | -40.0 | |||||||||
| Long Term Growth Rate, % | 2.00 | |||||||||
| Free cash flow (T + 1) | -21 | |||||||||
| Terminal Value | -661 | |||||||||
| Present Terminal Value | -514 | |||||||||
| Enterprise Value | -554 | |||||||||
| Net Debt | -1 | |||||||||
| Equity Value | -553 | |||||||||
| Diluted Shares Outstanding, MM | 1 | |||||||||
| Equity Value Per Share | -792.20 |
What You Will Get
- Real SNES Financial Data: Pre-filled with SenesTech’s historical and projected data for precise analysis.
- Fully Editable Template: Modify key inputs like revenue growth, WACC, and EBITDA % with ease.
- Automatic Calculations: See SenesTech’s intrinsic value update instantly based on your changes.
- Professional Valuation Tool: Designed for investors, analysts, and consultants seeking accurate DCF results.
- User-Friendly Design: Simple structure and clear instructions for all experience levels.
Key Features
- 🔍 Real-Life SNES Financials: Pre-filled historical and projected data for SenesTech, Inc. (SNES).
- ✏️ Fully Customizable Inputs: Adjust all critical parameters (yellow cells) like WACC, growth %, and tax rates.
- 📊 Professional DCF Valuation: Built-in formulas calculate SenesTech’s intrinsic value using the Discounted Cash Flow method.
- ⚡ Instant Results: Visualize SenesTech’s valuation instantly after making changes.
- Scenario Analysis: Test and compare outcomes for various financial assumptions side-by-side.
How It Works
- Download the Template: Get instant access to the Excel-based SenesTech, Inc. (SNES) DCF Calculator.
- Input Your Assumptions: Adjust yellow-highlighted cells for growth rates, WACC, margins, and more.
- Instant Calculations: The model automatically updates SenesTech’s intrinsic value.
- Test Scenarios: Simulate different assumptions to evaluate potential valuation changes.
- Analyze and Decide: Use the results to guide your investment or financial analysis.
Why Choose This Calculator for SenesTech, Inc. (SNES)?
- User-Friendly Interface: Perfectly crafted for both novices and seasoned professionals.
- Customizable Inputs: Effortlessly adjust parameters to suit your financial assessments.
- Real-Time Feedback: Observe immediate updates to SenesTech’s valuation as you tweak the inputs.
- Preloaded Data: Comes equipped with SenesTech’s latest financial information for swift evaluations.
- Relied Upon by Experts: Favored by investors and analysts for making well-informed choices.
Who Should Use This Product?
- Investors: Accurately assess SenesTech’s fair value before making investment choices.
- CFOs: Utilize a high-quality DCF model for financial reporting and analysis.
- Consultants: Easily customize the template for valuation reports tailored to clients.
- Entrepreneurs: Acquire insights into financial modeling practices employed by leading companies.
- Educators: Implement it as a teaching resource to illustrate valuation techniques.
What the Template Contains
- Pre-Filled DCF Model: SenesTech’s financial data preloaded for immediate use.
- WACC Calculator: Detailed calculations for Weighted Average Cost of Capital.
- Financial Ratios: Evaluate SenesTech’s profitability, leverage, and efficiency.
- Editable Inputs: Change assumptions such as growth, margins, and CAPEX to fit your scenarios.
- Financial Statements: Annual and quarterly reports to support detailed analysis.
- Interactive Dashboard: Easily visualize key valuation metrics and results.
Disclaimer
All information, articles, and product details provided on this website are for general informational and educational purposes only. We do not claim any ownership over, nor do we intend to infringe upon, any trademarks, copyrights, logos, brand names, or other intellectual property mentioned or depicted on this site. Such intellectual property remains the property of its respective owners, and any references here are made solely for identification or informational purposes, without implying any affiliation, endorsement, or partnership.
We make no representations or warranties, express or implied, regarding the accuracy, completeness, or suitability of any content or products presented. Nothing on this website should be construed as legal, tax, investment, financial, medical, or other professional advice. In addition, no part of this site—including articles or product references—constitutes a solicitation, recommendation, endorsement, advertisement, or offer to buy or sell any securities, franchises, or other financial instruments, particularly in jurisdictions where such activity would be unlawful.
All content is of a general nature and may not address the specific circumstances of any individual or entity. It is not a substitute for professional advice or services. Any actions you take based on the information provided here are strictly at your own risk. You accept full responsibility for any decisions or outcomes arising from your use of this website and agree to release us from any liability in connection with your use of, or reliance upon, the content or products found herein.