
|
Smith & Avaliação DCF do sobrinho PLC (SNN) |
Totalmente Editável: Adapte-Se Às Suas Necessidades No Excel Ou Planilhas
Design Profissional: Modelos Confiáveis E Padrão Da Indústria
Pré-Construídos Para Uso Rápido E Eficiente
Compatível com MAC/PC, totalmente desbloqueado
Não É Necessária Experiência; Fácil De Seguir
Smith & Nephew plc (SNN) Bundle
Descubra o verdadeiro valor de Smith & Sobrinho plc (SNN) com nossa calculadora DCF avançada! Ajuste as principais suposições, explore vários cenários e avalie como diferentes mudanças afetam Smith & Avaliação do sobrinho PLC (SNN)-Tudo dentro de um modelo de excel amigável.
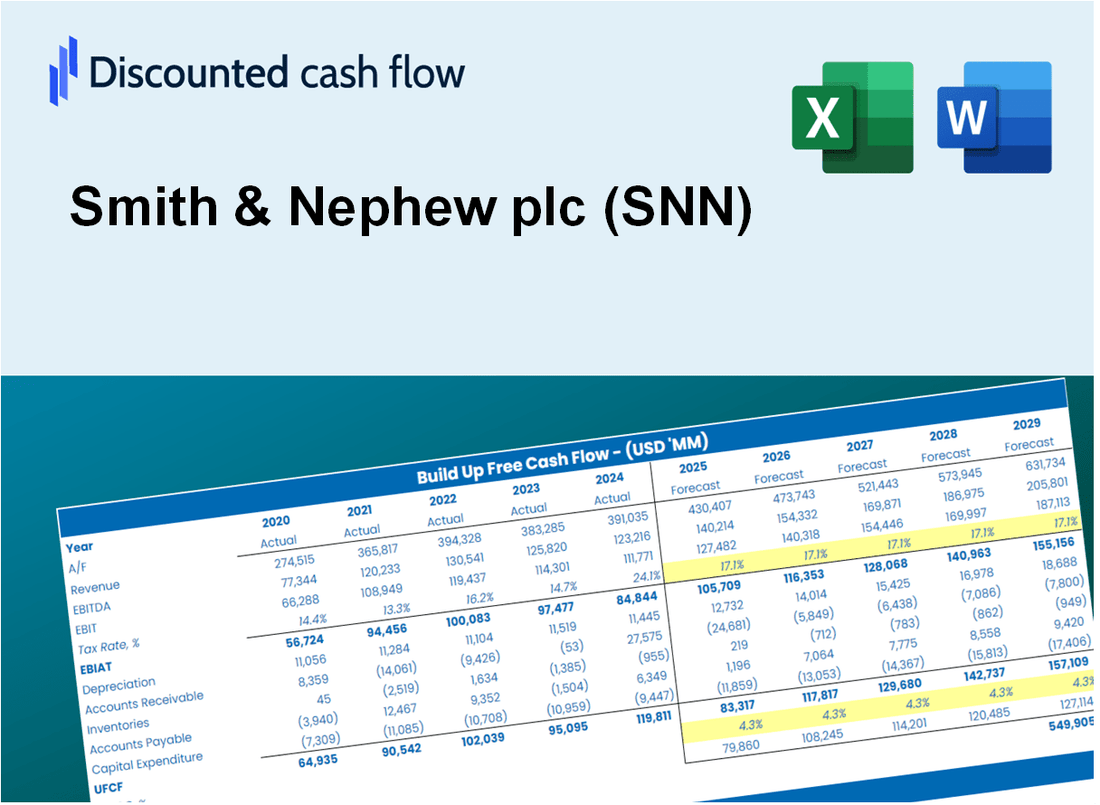
Discounted Cash Flow (DCF) - (USD MM)
| Year | AY1 2020 |
AY2 2021 |
AY3 2022 |
AY4 2023 |
AY5 2024 |
FY1 2025 |
FY2 2026 |
FY3 2027 |
FY4 2028 |
FY5 2029 |
|---|---|---|---|---|---|---|---|---|---|---|
| Revenue | 4,560.0 | 5,212.0 | 5,215.0 | 5,549.0 | 5,810.0 | 6,179.9 | 6,573.3 | 6,991.7 | 7,436.8 | 7,910.2 |
| Revenue Growth, % | 0 | 14.3 | 0.05755948 | 6.4 | 4.7 | 6.37 | 6.37 | 6.37 | 6.37 | 6.37 |
| EBITDA | 866.0 | 1,242.0 | 874.0 | 956.0 | 1,237.0 | 1,212.5 | 1,289.7 | 1,371.8 | 1,459.1 | 1,552.0 |
| EBITDA, % | 18.99 | 23.83 | 16.76 | 17.23 | 21.29 | 19.62 | 19.62 | 19.62 | 19.62 | 19.62 |
| Depreciation | 545.0 | 563.0 | 548.0 | 527.0 | 580.0 | 651.9 | 693.4 | 737.5 | 784.5 | 834.4 |
| Depreciation, % | 11.95 | 10.8 | 10.51 | 9.5 | 9.98 | 10.55 | 10.55 | 10.55 | 10.55 | 10.55 |
| EBIT | 321.0 | 679.0 | 326.0 | 429.0 | 657.0 | 560.6 | 596.3 | 634.3 | 674.6 | 717.6 |
| EBIT, % | 7.04 | 13.03 | 6.25 | 7.73 | 11.31 | 9.07 | 9.07 | 9.07 | 9.07 | 9.07 |
| Total Cash | 1,762.0 | 1,290.0 | 350.0 | 302.0 | 619.0 | 1,065.4 | 1,133.2 | 1,205.4 | 1,282.1 | 1,363.7 |
| Total Cash, percent | .0 | .0 | .0 | .0 | .0 | .0 | .0 | .0 | .0 | .0 |
| Account Receivables | 911.0 | 971.0 | 1,027.0 | 1,059.0 | 1,207.0 | 1,213.2 | 1,290.5 | 1,372.6 | 1,460.0 | 1,552.9 |
| Account Receivables, % | 19.98 | 18.63 | 19.69 | 19.08 | 20.77 | 19.63 | 19.63 | 19.63 | 19.63 | 19.63 |
| Inventories | 1,691.0 | 1,844.0 | 2,205.0 | 2,395.0 | 2,387.0 | 2,459.5 | 2,616.0 | 2,782.6 | 2,959.7 | 3,148.1 |
| Inventories, % | 37.08 | 35.38 | 42.28 | 43.16 | 41.08 | 39.8 | 39.8 | 39.8 | 39.8 | 39.8 |
| Accounts Payable | 891.0 | 1,043.0 | 1,029.0 | 1,016.0 | 1,082.0 | 1,189.2 | 1,264.9 | 1,345.4 | 1,431.1 | 1,522.2 |
| Accounts Payable, % | 19.54 | 20.01 | 19.73 | 18.31 | 18.62 | 19.24 | 19.24 | 19.24 | 19.24 | 19.24 |
| Capital Expenditure | -443.0 | -408.0 | -358.0 | -427.0 | -381.0 | -477.8 | -508.3 | -540.6 | -575.0 | -611.6 |
| Capital Expenditure, % | -9.71 | -7.83 | -6.86 | -7.7 | -6.56 | -7.73 | -7.73 | -7.73 | -7.73 | -7.73 |
| Tax Rate, % | 17.27 | 17.27 | 17.27 | 17.27 | 17.27 | 17.27 | 17.27 | 17.27 | 17.27 | 17.27 |
| EBITAT | 584.6 | 607.2 | 309.4 | 389.1 | 543.5 | 513.2 | 545.9 | 580.6 | 617.6 | 656.9 |
| Depreciation | ||||||||||
| Changes in Account Receivables | ||||||||||
| Changes in Inventories | ||||||||||
| Changes in Accounts Payable | ||||||||||
| Capital Expenditure | ||||||||||
| UFCF | -1,024.4 | 701.2 | 68.4 | 254.1 | 668.5 | 715.7 | 572.9 | 609.4 | 648.2 | 689.4 |
| WACC, % | 6.27 | 6.1 | 6.19 | 6.12 | 5.99 | 6.13 | 6.13 | 6.13 | 6.13 | 6.13 |
| PV UFCF | ||||||||||
| SUM PV UFCF | 2,715.4 | |||||||||
| Long Term Growth Rate, % | 2.00 | |||||||||
| Free cash flow (T + 1) | 703 | |||||||||
| Terminal Value | 17,008 | |||||||||
| Present Terminal Value | 12,629 | |||||||||
| Enterprise Value | 15,345 | |||||||||
| Net Debt | 2,702 | |||||||||
| Equity Value | 12,643 | |||||||||
| Diluted Shares Outstanding, MM | 219 | |||||||||
| Equity Value Per Share | 57.69 |
What You Will Receive
- Adjustable Forecast Parameters: Effortlessly modify key assumptions (growth %, margins, WACC) to explore various scenarios.
- Comprehensive Market Data: Smith & Nephew plc’s financial data pre-loaded to facilitate your analysis.
- Automated DCF Calculations: The template computes Net Present Value (NPV) and intrinsic value for you automatically.
- Tailorable and Professional: A refined Excel model that aligns with your valuation requirements.
- Designed for Analysts and Investors: Perfect for assessing projections, confirming strategies, and enhancing efficiency.
Key Features
- 🔍 Real-Life SNN Financials: Pre-filled historical and projected data for Smith & Nephew plc (SNN).
- ✏️ Fully Customizable Inputs: Adjust all critical parameters (yellow cells) like WACC, growth %, and tax rates.
- 📊 Professional DCF Valuation: Built-in formulas calculate Smith & Nephew’s intrinsic value using the Discounted Cash Flow method.
- ⚡ Instant Results: Visualize Smith & Nephew’s valuation instantly after making changes.
- Scenario Analysis: Test and compare outcomes for various financial assumptions side-by-side.
How It Works
- Step 1: Download the Excel file.
- Step 2: Review pre-entered Smith & Nephew data (historical and projected).
- Step 3: Adjust key assumptions (yellow cells) based on your analysis.
- Step 4: View automatic recalculations for Smith & Nephew’s intrinsic value.
- Step 5: Use the outputs for investment decisions or reporting.
Why Choose This Calculator for Smith & Nephew plc (SNN)?
- Designed for Experts: A specialized tool tailored for analysts, CFOs, and healthcare consultants.
- Accurate Financials: Smith & Nephew’s historical and projected financial data preloaded for precision.
- Forecast Simulation: Effortlessly model various scenarios and assumptions.
- Comprehensive Outputs: Automatically computes intrinsic value, NPV, and essential financial metrics.
- User-Friendly: Clear, step-by-step guidance to navigate the calculation process.
Who Should Use This Product?
- Healthcare Investors: Develop comprehensive and accurate valuation models for portfolio assessment related to Smith & Nephew plc (SNN).
- Corporate Finance Teams: Evaluate valuation scenarios to inform strategic decisions within the healthcare sector.
- Consultants and Advisors: Offer clients precise valuation insights for Smith & Nephew plc (SNN) stock.
- Students and Educators: Utilize real-world data to practice and teach financial modeling in the context of medical technology.
- Medical Technology Enthusiasts: Gain insights into how companies like Smith & Nephew plc (SNN) are valued in the market.
What the Template Contains
- Pre-Filled Data: Contains Smith & Nephew plc's historical financials and projections.
- Discounted Cash Flow Model: Editable DCF valuation model with automatic calculations.
- Weighted Average Cost of Capital (WACC): A dedicated sheet for calculating WACC based on custom inputs.
- Key Financial Ratios: Evaluate Smith & Nephew plc's profitability, efficiency, and leverage.
- Customizable Inputs: Easily modify revenue growth, margins, and tax rates.
- Clear Dashboard: Visuals and tables summarizing key valuation outcomes.
Disclaimer
All information, articles, and product details provided on this website are for general informational and educational purposes only. We do not claim any ownership over, nor do we intend to infringe upon, any trademarks, copyrights, logos, brand names, or other intellectual property mentioned or depicted on this site. Such intellectual property remains the property of its respective owners, and any references here are made solely for identification or informational purposes, without implying any affiliation, endorsement, or partnership.
We make no representations or warranties, express or implied, regarding the accuracy, completeness, or suitability of any content or products presented. Nothing on this website should be construed as legal, tax, investment, financial, medical, or other professional advice. In addition, no part of this site—including articles or product references—constitutes a solicitation, recommendation, endorsement, advertisement, or offer to buy or sell any securities, franchises, or other financial instruments, particularly in jurisdictions where such activity would be unlawful.
All content is of a general nature and may not address the specific circumstances of any individual or entity. It is not a substitute for professional advice or services. Any actions you take based on the information provided here are strictly at your own risk. You accept full responsibility for any decisions or outcomes arising from your use of this website and agree to release us from any liability in connection with your use of, or reliance upon, the content or products found herein.