
|
Sobha Limited (Sobha.NS) Avaliação DCF |
Totalmente Editável: Adapte-Se Às Suas Necessidades No Excel Ou Planilhas
Design Profissional: Modelos Confiáveis E Padrão Da Indústria
Pré-Construídos Para Uso Rápido E Eficiente
Compatível com MAC/PC, totalmente desbloqueado
Não É Necessária Experiência; Fácil De Seguir
Sobha Limited (SOBHA.NS) Bundle
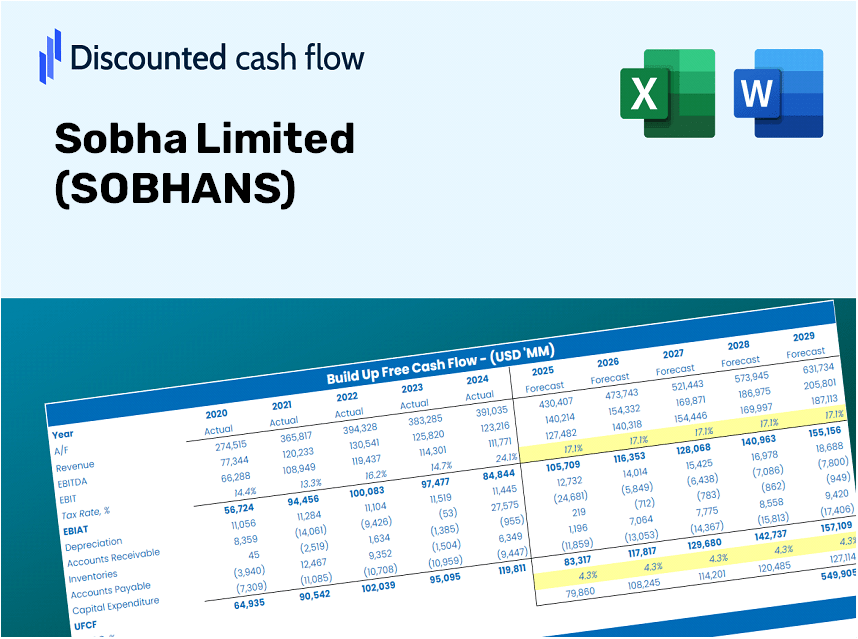
Obtenha informações sobre sua análise de avaliação Sobha Limited (Sobhans) com nossa sofisticada calculadora DCF! Este modelo do Excel é pré -carregado com dados reais da Sobha Limited (Sobhans), permitindo ajustar as previsões e suposições para um cálculo preciso do valor intrínseco Sobha Limited (Sobhans).
What You Will Receive
- Accurate SOBHANS Financials: Contains both historical and projected data for precise valuation.
- Customizable Inputs: Adjust parameters such as WACC, tax rates, revenue growth, and capital investments.
- Automated Calculations: Intrinsic value and NPV are calculated in real-time.
- Scenario Analysis: Explore various scenarios to assess Sobha Limited's future performance.
- User-Friendly Design: Designed for professionals while remaining accessible for newcomers.
Key Features of Sobha Limited (SOBHANS)
- Customizable Growth Assumptions: Adjust essential inputs such as revenue growth rates, EBITDA margins, and capital expenditure projections.
- Instant DCF Valuation: Automatically computes intrinsic value, NPV, and other financial metrics without delay.
- High-Precision Accuracy: Leverages Sobha's actual financial data to deliver dependable valuation insights.
- Effortless Scenario Analysis: Easily explore various assumptions and assess different results side by side.
- Efficiency Boosting Tool: Streamline your process by avoiding the complexities of building valuation models from the ground up.
How It Works
- Step 1: Download the Excel file.
- Step 2: Review pre-entered Sobha Limited (SOBHANS) data (historical and projected).
- Step 3: Adjust key assumptions (yellow cells) based on your analysis.
- Step 4: Observe automatic recalculations for Sobha Limited’s intrinsic value.
- Step 5: Utilize the outputs for investment decisions or reporting.
Why Opt for the Sobha Limited (SOBHANS) Calculator?
- Precision: Utilizes accurate Sobha Limited financials to ensure reliable data.
- Adaptability: Tailored for users to easily adjust and experiment with inputs.
- Efficiency: Eliminate the need to create a financial model from the ground up.
- High-Quality: Crafted with the precision and practicality expected at the CFO level.
- Intuitive: Simple to navigate, making it accessible for those new to financial modeling.
Who Can Benefit from This Product?
- Professional Investors: Create comprehensive and dependable valuation models for analyzing portfolios.
- Corporate Finance Teams: Evaluate valuation scenarios to inform strategic decisions within the organization.
- Consultants and Advisors: Deliver precise valuation insights for Sobha Limited (SOBHANS) to clients.
- Students and Educators: Leverage real-world data to enhance learning and practice in financial modeling.
- Real Estate Enthusiasts: Gain insights into how companies like Sobha Limited (SOBHANS) are valued in the real estate market.
Overview of Template Features
- Pre-Filled DCF Model: Sobha Limited’s (SOBHANS) financial data preloaded for immediate application.
- WACC Calculator: Comprehensive calculations for the Weighted Average Cost of Capital.
- Financial Ratios: Analyze Sobha Limited’s profitability, leverage, and operational efficiency.
- Edit-Friendly Inputs: Modify assumptions such as growth rates, profit margins, and capital expenditures for tailored scenarios.
- Financial Statements: Access annual and quarterly reports to enhance detailed financial analysis.
- Interactive Dashboard: Effortlessly visualize essential valuation metrics and outcomes.
Disclaimer
All information, articles, and product details provided on this website are for general informational and educational purposes only. We do not claim any ownership over, nor do we intend to infringe upon, any trademarks, copyrights, logos, brand names, or other intellectual property mentioned or depicted on this site. Such intellectual property remains the property of its respective owners, and any references here are made solely for identification or informational purposes, without implying any affiliation, endorsement, or partnership.
We make no representations or warranties, express or implied, regarding the accuracy, completeness, or suitability of any content or products presented. Nothing on this website should be construed as legal, tax, investment, financial, medical, or other professional advice. In addition, no part of this site—including articles or product references—constitutes a solicitation, recommendation, endorsement, advertisement, or offer to buy or sell any securities, franchises, or other financial instruments, particularly in jurisdictions where such activity would be unlawful.
All content is of a general nature and may not address the specific circumstances of any individual or entity. It is not a substitute for professional advice or services. Any actions you take based on the information provided here are strictly at your own risk. You accept full responsibility for any decisions or outcomes arising from your use of this website and agree to release us from any liability in connection with your use of, or reliance upon, the content or products found herein.