
|
Sofina Société Anonyme (SOF.BR) Avaliação DCF |
Totalmente Editável: Adapte-Se Às Suas Necessidades No Excel Ou Planilhas
Design Profissional: Modelos Confiáveis E Padrão Da Indústria
Pré-Construídos Para Uso Rápido E Eficiente
Compatível com MAC/PC, totalmente desbloqueado
Não É Necessária Experiência; Fácil De Seguir
Sofina SA (SOF.BR) Bundle
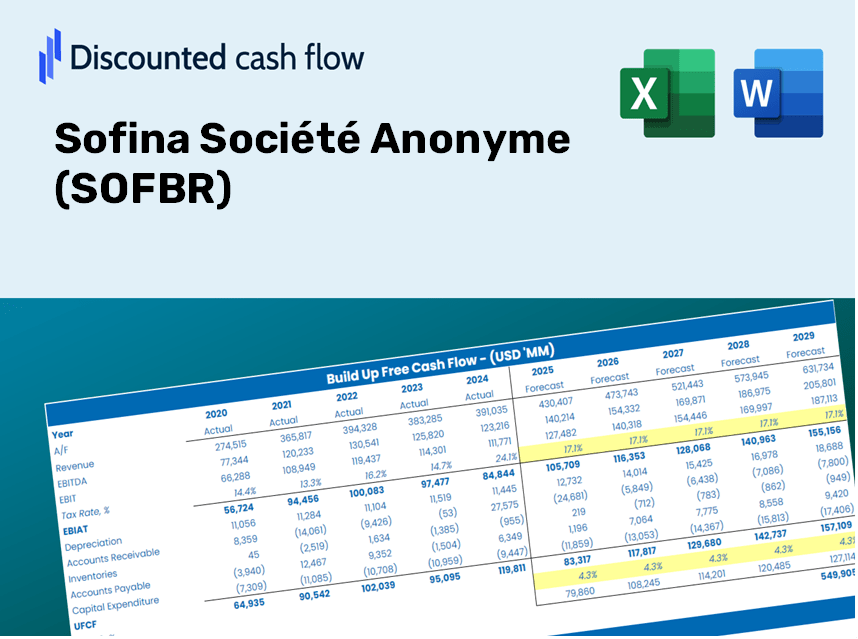
Descubra o verdadeiro potencial do Sofina Société Anononme (SOFBR) com nossa calculadora DCF avançada! Ajuste as principais premissas, explore vários cenários e avalie como as mudanças afetam a avaliação de Sofina-tudo dentro de um modelo de excelente fácil de usar.
Discounted Cash Flow (DCF) - (USD MM)
| Year | AY1 2020 |
AY2 2021 |
AY3 2022 |
AY4 2023 |
AY5 2024 |
FY1 2025 |
FY2 2026 |
FY3 2027 |
FY4 2028 |
FY5 2029 |
|---|---|---|---|---|---|---|---|---|---|---|
| Revenue | 1,421.9 | 2,651.5 | -1,827.8 | -55.1 | 1,431.8 | 678.3 | 321.3 | 152.2 | 72.1 | 34.2 |
| Revenue Growth, % | 0 | 86.47 | -168.93 | -96.98 | -2696.33 | -52.63 | -52.63 | -52.63 | -52.63 | -52.63 |
| EBITDA | 1,379.0 | 2,592.6 | -1,863.0 | .0 | 1,367.5 | 529.4 | 250.8 | 118.8 | 56.3 | 26.7 |
| EBITDA, % | 96.98 | 97.78 | 101.93 | 0 | 95.51 | 78.05 | 78.05 | 78.05 | 78.05 | 78.05 |
| Depreciation | .0 | -2,597.4 | 1,863.4 | 93.4 | .0 | -404.2 | -191.5 | -90.7 | -43.0 | -20.4 |
| Depreciation, % | 0 | -97.96 | -101.95 | -169.36 | 0 | -59.59 | -59.59 | -59.59 | -59.59 | -59.59 |
| EBIT | 1,379.0 | 5,190.0 | -3,726.5 | -93.4 | 1,367.5 | 668.1 | 316.5 | 149.9 | 71.0 | 33.6 |
| EBIT, % | 96.98 | 195.74 | 203.88 | 169.36 | 95.51 | 98.5 | 98.5 | 98.5 | 98.5 | 98.5 |
| Total Cash | 432.6 | 140.7 | 818.9 | 712.6 | 357.4 | -114.1 | -54.1 | -25.6 | -12.1 | -5.7 |
| Total Cash, percent | .0 | .0 | .0 | .0 | .0 | .0 | .0 | .0 | .0 | .0 |
| Account Receivables | 783.0 | 802.0 | 828.7 | 167.3 | 486.5 | -35.3 | -16.7 | -7.9 | -3.8 | -1.8 |
| Account Receivables, % | 55.06 | 30.25 | -45.34 | -303.32 | 33.97 | -5.21 | -5.21 | -5.21 | -5.21 | -5.21 |
| Inventories | .0 | .0 | .0 | .0 | .0 | .0 | .0 | .0 | .0 | .0 |
| Inventories, % | 0 | 0 | 0 | 0 | 0 | 0 | 0 | 0 | 0 | 0 |
| Accounts Payable | .4 | 1.5 | 1.4 | 1.4 | 2.8 | -3.2 | -1.5 | -.7 | -.3 | -.2 |
| Accounts Payable, % | 0.03143593 | 0.05826868 | -0.07511697 | -2.53 | 0.19332 | -0.46542 | -0.46542 | -0.46542 | -0.46542 | -0.46542 |
| Capital Expenditure | -.4 | -.5 | -.1 | -.4 | -.2 | -.1 | .0 | .0 | .0 | .0 |
| Capital Expenditure, % | -0.02953711 | -0.01844232 | 0.0070576 | 0.79785 | -0.01096502 | -0.01178889 | -0.01178889 | -0.01178889 | -0.01178889 | -0.01178889 |
| Tax Rate, % | 0.000514890637 | 0.000514890637 | 0.000514890637 | 0.000514890637 | 0.000514890637 | 0.000514890637 | 0.000514890637 | 0.000514890637 | 0.000514890637 | 0.000514890637 |
| EBITAT | 1,379.1 | 5,191.7 | -3,723.4 | -93.4 | 1,367.5 | 668.0 | 316.4 | 149.9 | 71.0 | 33.6 |
| Depreciation | ||||||||||
| Changes in Account Receivables | ||||||||||
| Changes in Inventories | ||||||||||
| Changes in Accounts Payable | ||||||||||
| Capital Expenditure | ||||||||||
| UFCF | 596.1 | 2,575.8 | -1,886.9 | 661.0 | 1,049.5 | 779.6 | 108.0 | 51.2 | 24.2 | 11.5 |
| WACC, % | 8.88 | 8.88 | 8.88 | 8.88 | 8.88 | 8.88 | 8.88 | 8.88 | 8.88 | 8.88 |
| PV UFCF | ||||||||||
| SUM PV UFCF | 871.4 | |||||||||
| Long Term Growth Rate, % | 2.00 | |||||||||
| Free cash flow (T + 1) | 12 | |||||||||
| Terminal Value | 170 | |||||||||
| Present Terminal Value | 111 | |||||||||
| Enterprise Value | 983 | |||||||||
| Net Debt | 480 | |||||||||
| Equity Value | 502 | |||||||||
| Diluted Shares Outstanding, MM | 34 | |||||||||
| Equity Value Per Share | 14.81 |
Benefits You Will Receive
- Genuine Sofina Data: Comprehensive financials – encompassing revenue to EBIT – derived from actual and forecasted figures.
- Comprehensive Customization: Modify all essential parameters (highlighted cells) such as WACC, growth %, and tax rates.
- Instant Valuation Revisions: Automatic recalculations that allow you to assess the effects of modifications on Sofina's fair value.
- Flexible Excel Template: Designed for easy modifications, scenario analysis, and thorough forecasting.
- Efficient and Precise: Eliminate the need to construct models from the ground up while ensuring both accuracy and adaptability.
Key Features
- Authentic Financial Data for Sofina (SOFBR): Access reliable historical data and future forecasts pre-loaded for convenience.
- Customizable Assumptions: Simply modify highlighted cells for metrics like WACC, growth rates, and profit margins.
- Real-Time Calculations: Automatic updates for DCF, Net Present Value (NPV), and cash flow analyses.
- User-Friendly Dashboard: Intuitive charts and summaries that make it easy to comprehend your valuation outcomes.
- Designed for All Skill Levels: A straightforward, user-friendly layout tailored for investors, CFOs, and consultants alike.
How It Operates
- 1. Access the Template: Download and open the Excel file featuring Sofina Société Anonyme’s (SOFBR) preloaded data.
- 2. Modify Assumptions: Adjust key parameters such as growth rates, WACC, and capital expenditures.
- 3. Obtain Immediate Results: The DCF model automatically calculates intrinsic value and NPV in real-time.
- 4. Explore Scenarios: Evaluate various forecasts to assess different valuation possibilities.
- 5. Utilize with Assurance: Present expert valuation insights to enhance your decision-making process.
Why Opt for This Calculator?
- Designed for Experts: A sophisticated tool favored by analysts, CFOs, and financial consultants.
- Accurate Financial Data: Preloaded historical and projected financial figures for Sofina Société Anonyme (SOFBR) to ensure precision.
- Flexible Scenario Analysis: Effortlessly simulate various forecasts and assumptions.
- Comprehensive Outputs: Automatically computes intrinsic value, NPV, and other essential metrics.
- User-Friendly: Clear, step-by-step instructions facilitate a smooth experience.
Who Can Benefit from This Product?
- Professional Investors: Create comprehensive and trustworthy valuation models for portfolio assessment.
- Corporate Finance Teams: Evaluate valuation scenarios to inform internal decision-making.
- Consultants and Advisors: Deliver precise valuation insights for Sofina Société Anonyme (SOFBR) to clients.
- Students and Educators: Utilize real-world data to enhance financial modeling skills and education.
- Investment Enthusiasts: Gain insights into how companies like Sofina are appraised within the market.
Contents of the Template
- Historical Data: Contains past financial information and baseline forecasts for Sofina Société Anonyme (SOFBR).
- DCF and Levered DCF Models: Comprehensive templates designed to calculate the intrinsic value of Sofina Société Anonyme (SOFBR).
- WACC Sheet: Pre-configured calculations for the Weighted Average Cost of Capital.
- Editable Inputs: Customize essential drivers such as growth rates, EBITDA %, and CAPEX assumptions.
- Quarterly and Annual Statements: A thorough analysis of Sofina Société Anonyme (SOFBR)’s financials.
- Interactive Dashboard: Dynamically visualize valuation results and forecasts.
Disclaimer
All information, articles, and product details provided on this website are for general informational and educational purposes only. We do not claim any ownership over, nor do we intend to infringe upon, any trademarks, copyrights, logos, brand names, or other intellectual property mentioned or depicted on this site. Such intellectual property remains the property of its respective owners, and any references here are made solely for identification or informational purposes, without implying any affiliation, endorsement, or partnership.
We make no representations or warranties, express or implied, regarding the accuracy, completeness, or suitability of any content or products presented. Nothing on this website should be construed as legal, tax, investment, financial, medical, or other professional advice. In addition, no part of this site—including articles or product references—constitutes a solicitation, recommendation, endorsement, advertisement, or offer to buy or sell any securities, franchises, or other financial instruments, particularly in jurisdictions where such activity would be unlawful.
All content is of a general nature and may not address the specific circumstances of any individual or entity. It is not a substitute for professional advice or services. Any actions you take based on the information provided here are strictly at your own risk. You accept full responsibility for any decisions or outcomes arising from your use of this website and agree to release us from any liability in connection with your use of, or reliance upon, the content or products found herein.