
|
Sun Pharma Advanced Research Company Limited (SPARC.NS) Avaliação DCF |
Totalmente Editável: Adapte-Se Às Suas Necessidades No Excel Ou Planilhas
Design Profissional: Modelos Confiáveis E Padrão Da Indústria
Pré-Construídos Para Uso Rápido E Eficiente
Compatível com MAC/PC, totalmente desbloqueado
Não É Necessária Experiência; Fácil De Seguir
Sun Pharma Advanced Research Company Limited (SPARC.NS) Bundle
Descubra o verdadeiro potencial da Sun Pharma Advanced Research Company Limited (SPARCNS) com nossa calculadora avançada de DCF! Ajuste as suposições críticas, explore vários cenários e examine como os ajustes afetam a avaliação da Sun Pharma Advanced Research Company Limited (SPARCNS)-tudo dentro de um modelo de Excel amigável.
Benefits of Using Our Model
- Flexible Forecast Parameters: Modify key assumptions (growth %, margins, WACC) effortlessly to explore various scenarios.
- Comprehensive Data: SPARCNS’s financial information pre-loaded to facilitate your analysis.
- Automated DCF Calculations: The template computes Net Present Value (NPV) and intrinsic value automatically.
- Customizable and Professional Design: A sleek Excel model tailored to meet your valuation requirements.
- Designed for Analysts and Investors: Perfect for evaluating projections, validating strategies, and enhancing efficiency.
Key Features
- Customizable Forecast Inputs: Adjust essential variables such as revenue growth, EBITDA %, and capital expenditures for (SPARCNS).
- Instant DCF Valuation: Automatically computes intrinsic value, NPV, and additional metrics in real-time for (SPARCNS).
- High-Precision Accuracy: Leverages real-world financial data from Sun Pharma for reliable valuation results.
- Streamlined Scenario Analysis: Effortlessly evaluate various assumptions and analyze different outcomes for (SPARCNS).
- Efficiency Booster: Remove the hassle of creating intricate valuation models from the ground up for (SPARCNS).
How It Functions
- Step 1: Download the Excel file.
- Step 2: Examine the pre-filled Sun Pharma data (historical and forecasted).
- Step 3: Modify key assumptions (highlighted in yellow) based on your insights.
- Step 4: Observe real-time recalculations for Sun Pharma’s intrinsic value.
- Step 5: Utilize the results for investment analysis or reporting.
Why Choose This Calculator for Sun Pharma Advanced Research Company Limited (SPARCNS)?
- Precision: Utilizes authentic financial data from Sun Pharma to ensure accuracy.
- Adaptability: Allows users to easily test and modify input parameters.
- Efficiency: Eliminate the need to construct a DCF model from the ground up.
- Expert-Level: Created with the insight and usability expected at the CFO level.
- Intuitive: Designed for ease of use, suitable even for those new to financial modeling.
Who Can Benefit from This Product?
- Pharmaceutical Students: Master valuation techniques and apply them with real-world data.
- Researchers: Integrate professional models into your academic projects or studies.
- Investors: Validate your own assumptions and assess valuation outcomes for Sun Pharma Advanced Research Company Limited (SPARCNS).
- Market Analysts: Enhance your efficiency with a ready-to-use, customizable DCF model.
- Entrepreneurs: Discover how major pharmaceutical companies like Sun Pharma are evaluated.
Contents of the Template
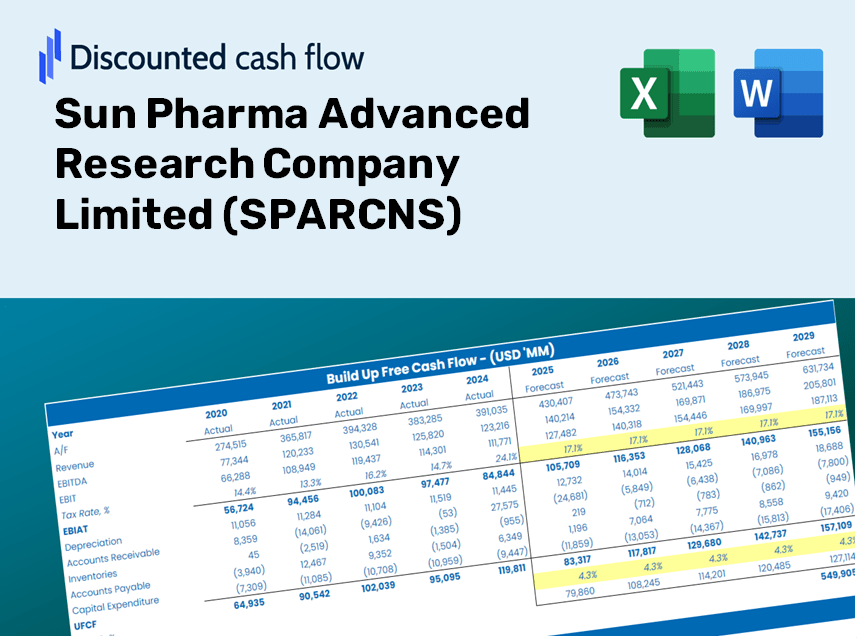
- Operating and Balance Sheet Data: Pre-filled historical data and forecasts for Sun Pharma Advanced Research Company Limited (SPARCNS), including revenue, EBITDA, EBIT, and capital expenditures.
- WACC Calculation: A dedicated sheet for calculating the Weighted Average Cost of Capital (WACC), including parameters like Beta, risk-free rate, and share price.
- DCF Valuation (Unlevered and Levered): Editable Discounted Cash Flow models that illustrate intrinsic value with comprehensive calculations.
- Financial Statements: Pre-loaded annual and quarterly financial statements to facilitate in-depth analysis.
- Key Ratios: A collection of profitability, leverage, and efficiency ratios specifically for Sun Pharma Advanced Research Company Limited (SPARCNS).
- Dashboard and Charts: A visual summary of valuation outputs and assumptions, making it easy to analyze results.
Disclaimer
All information, articles, and product details provided on this website are for general informational and educational purposes only. We do not claim any ownership over, nor do we intend to infringe upon, any trademarks, copyrights, logos, brand names, or other intellectual property mentioned or depicted on this site. Such intellectual property remains the property of its respective owners, and any references here are made solely for identification or informational purposes, without implying any affiliation, endorsement, or partnership.
We make no representations or warranties, express or implied, regarding the accuracy, completeness, or suitability of any content or products presented. Nothing on this website should be construed as legal, tax, investment, financial, medical, or other professional advice. In addition, no part of this site—including articles or product references—constitutes a solicitation, recommendation, endorsement, advertisement, or offer to buy or sell any securities, franchises, or other financial instruments, particularly in jurisdictions where such activity would be unlawful.
All content is of a general nature and may not address the specific circumstances of any individual or entity. It is not a substitute for professional advice or services. Any actions you take based on the information provided here are strictly at your own risk. You accept full responsibility for any decisions or outcomes arising from your use of this website and agree to release us from any liability in connection with your use of, or reliance upon, the content or products found herein.