
|
Spire Healthcare Group plc (spi.l) Avaliação DCF |
Totalmente Editável: Adapte-Se Às Suas Necessidades No Excel Ou Planilhas
Design Profissional: Modelos Confiáveis E Padrão Da Indústria
Pré-Construídos Para Uso Rápido E Eficiente
Compatível com MAC/PC, totalmente desbloqueado
Não É Necessária Experiência; Fácil De Seguir
Spire Healthcare Group plc (SPI.L) Bundle
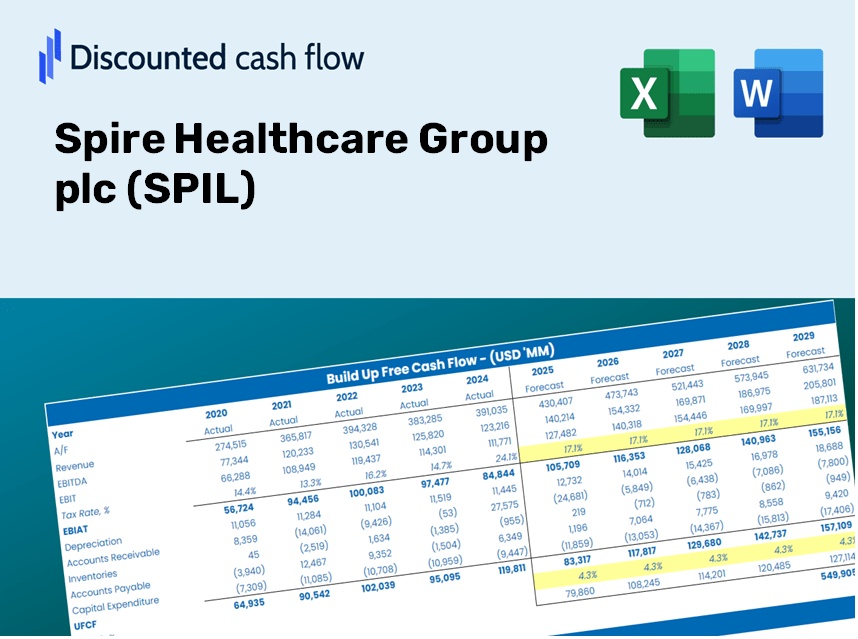
Otimize seu tempo e melhore a precisão com nossa calculadora DCF de assistência médica do Spire! Utilizando dados reais do Spire Healthcare Group Plc (SPIL) e suposições personalizáveis, essa ferramenta permite que você preveja, analise e avalie a Spire Healthcare como um investidor especialista.
Discounted Cash Flow (DCF) - (USD MM)
| Year | AY1 2020 |
AY2 2021 |
AY3 2022 |
AY4 2023 |
AY5 2024 |
FY1 2025 |
FY2 2026 |
FY3 2027 |
FY4 2028 |
FY5 2029 |
|---|---|---|---|---|---|---|---|---|---|---|
| Revenue | 919.9 | 1,106.2 | 1,198.5 | 1,359.0 | 1,511.2 | 1,712.1 | 1,939.8 | 2,197.7 | 2,490.0 | 2,821.0 |
| Revenue Growth, % | 0 | 20.25 | 8.34 | 13.39 | 11.2 | 13.3 | 13.3 | 13.3 | 13.3 | 13.3 |
| EBITDA | -51.9 | 182.2 | 193.3 | 231.2 | 250.4 | 207.3 | 234.9 | 266.1 | 301.5 | 341.6 |
| EBITDA, % | -5.64 | 16.47 | 16.13 | 17.01 | 16.57 | 12.11 | 12.11 | 12.11 | 12.11 | 12.11 |
| Depreciation | 94.0 | 97.1 | 97.9 | 103.6 | 112.2 | 144.5 | 163.8 | 185.5 | 210.2 | 238.2 |
| Depreciation, % | 10.22 | 8.78 | 8.17 | 7.62 | 7.42 | 8.44 | 8.44 | 8.44 | 8.44 | 8.44 |
| EBIT | -145.9 | 85.1 | 95.4 | 127.6 | 138.2 | 62.8 | 71.1 | 80.6 | 91.3 | 103.4 |
| EBIT, % | -15.86 | 7.69 | 7.96 | 9.39 | 9.15 | 3.67 | 3.67 | 3.67 | 3.67 | 3.67 |
| Total Cash | 106.3 | 202.6 | 74.2 | 49.6 | 43.7 | 145.9 | 165.3 | 187.3 | 212.2 | 240.4 |
| Total Cash, percent | .0 | .0 | .0 | .0 | .0 | .0 | .0 | .0 | .0 | .0 |
| Account Receivables | 83.1 | 80.8 | 84.8 | 99.7 | 105.3 | 129.2 | 146.3 | 165.8 | 187.8 | 212.8 |
| Account Receivables, % | 9.03 | 7.3 | 7.08 | 7.34 | 6.97 | 7.54 | 7.54 | 7.54 | 7.54 | 7.54 |
| Inventories | 37.6 | 40.2 | 40.6 | 44.3 | 46.6 | 59.8 | 67.7 | 76.7 | 86.9 | 98.5 |
| Inventories, % | 4.09 | 3.63 | 3.39 | 3.26 | 3.08 | 3.49 | 3.49 | 3.49 | 3.49 | 3.49 |
| Accounts Payable | 58.0 | 51.7 | 67.2 | 63.9 | 84.9 | 92.1 | 104.4 | 118.3 | 134.0 | 151.8 |
| Accounts Payable, % | 6.31 | 4.67 | 5.61 | 4.7 | 5.62 | 5.38 | 5.38 | 5.38 | 5.38 | 5.38 |
| Capital Expenditure | -46.6 | -69.3 | -87.7 | -84.4 | -112.1 | -110.5 | -125.2 | -141.9 | -160.7 | -182.1 |
| Capital Expenditure, % | -5.07 | -6.26 | -7.32 | -6.21 | -7.42 | -6.46 | -6.46 | -6.46 | -6.46 | -6.46 |
| Tax Rate, % | 33.68 | 33.68 | 33.68 | 33.68 | 33.68 | 33.68 | 33.68 | 33.68 | 33.68 | 33.68 |
| EBITAT | -147.7 | 434.5 | 210.4 | 100.7 | 91.7 | 55.9 | 63.3 | 71.7 | 81.3 | 92.1 |
| Depreciation | ||||||||||
| Changes in Account Receivables | ||||||||||
| Changes in Inventories | ||||||||||
| Changes in Accounts Payable | ||||||||||
| Capital Expenditure | ||||||||||
| UFCF | -163.0 | 455.7 | 231.7 | 98.0 | 104.9 | 60.1 | 89.0 | 100.8 | 114.2 | 129.4 |
| WACC, % | 7.51 | 7.51 | 7.51 | 6.57 | 6.01 | 7.02 | 7.02 | 7.02 | 7.02 | 7.02 |
| PV UFCF | ||||||||||
| SUM PV UFCF | 395.4 | |||||||||
| Long Term Growth Rate, % | 3.50 | |||||||||
| Free cash flow (T + 1) | 134 | |||||||||
| Terminal Value | 3,801 | |||||||||
| Present Terminal Value | 2,707 | |||||||||
| Enterprise Value | 3,103 | |||||||||
| Net Debt | 1,239 | |||||||||
| Equity Value | 1,864 | |||||||||
| Diluted Shares Outstanding, MM | 411 | |||||||||
| Equity Value Per Share | 453.06 |
What You Will Receive
- Genuine SPIL Financial Data: Features both historical and projected figures for precise valuation.
- Customizable Variables: Adjust WACC, tax rates, revenue growth, and capital expenditures to fit your analysis.
- Real-Time Calculations: Intrinsic value and NPV are calculated automatically as inputs change.
- Scenario Testing: Explore various scenarios to assess the future performance of Spire Healthcare Group.
- User-Friendly Interface: Designed for professionals, yet easy for newcomers to navigate.
Key Features
- Pre-Loaded Data: Spire Healthcare Group plc’s historical financial statements and pre-filled forecasts.
- Fully Adjustable Inputs: Modify WACC, tax rates, revenue growth, and EBITDA margins as needed.
- Instant Results: Observe Spire Healthcare’s intrinsic value recalculating in real time.
- Clear Visual Outputs: Dashboard charts present valuation results and essential metrics.
- Built for Accuracy: A professional tool designed for analysts, investors, and finance experts.
How It Works
- Download: Obtain the pre-prepared Excel file featuring Spire Healthcare Group plc's (SPIL) financial data.
- Customize: Tailor your forecasts by modifying revenue growth, EBITDA %, and WACC parameters.
- Update Automatically: Watch as the intrinsic value and NPV calculations refresh dynamically.
- Test Scenarios: Generate various projections and instantly compare their results.
- Make Decisions: Leverage the valuation findings to inform your investment approach.
Why Opt for Spire Healthcare Group plc (SPIL) Calculator?
- Time-Efficient: Skip the hassle of building a DCF model from the ground up – our tool is ready for immediate use.
- Enhanced Accuracy: Dependable financial data and calculations minimize valuation errors.
- Completely Customizable: Adjust the model to fit your specific assumptions and forecasts.
- User-Friendly: Intuitive charts and outputs facilitate easy result analysis.
- Endorsed by Professionals: Created for experts who prioritize accuracy and functionality.
Who Can Benefit from This Product?
- Healthcare Investors: Develop comprehensive and accurate valuation models for portfolio assessments.
- Corporate Finance Teams: Examine valuation scenarios to inform strategic decisions within their organization.
- Consultants and Advisors: Deliver precise valuation insights for Spire Healthcare Group plc (SPIL) to clients.
- Students and Educators: Utilize real-time data for financial modeling practice and instruction.
- Healthcare Enthusiasts: Gain insights into how healthcare companies like Spire are appraised in the market.
Contents of the Template
- Historical Data: Features Spire Healthcare Group's (SPIL) previous financial performance and foundational forecasts.
- DCF and Levered DCF Models: Comprehensive templates to assess the intrinsic value of Spire Healthcare Group (SPIL).
- WACC Sheet: Pre-configured calculations for the Weighted Average Cost of Capital.
- Editable Inputs: Customize key parameters such as growth rates, EBITDA margins, and capital expenditure assumptions.
- Quarterly and Annual Statements: An extensive overview of Spire Healthcare Group's (SPIL) financials.
- Interactive Dashboard: Dynamically visualize valuation results and future projections.
Disclaimer
All information, articles, and product details provided on this website are for general informational and educational purposes only. We do not claim any ownership over, nor do we intend to infringe upon, any trademarks, copyrights, logos, brand names, or other intellectual property mentioned or depicted on this site. Such intellectual property remains the property of its respective owners, and any references here are made solely for identification or informational purposes, without implying any affiliation, endorsement, or partnership.
We make no representations or warranties, express or implied, regarding the accuracy, completeness, or suitability of any content or products presented. Nothing on this website should be construed as legal, tax, investment, financial, medical, or other professional advice. In addition, no part of this site—including articles or product references—constitutes a solicitation, recommendation, endorsement, advertisement, or offer to buy or sell any securities, franchises, or other financial instruments, particularly in jurisdictions where such activity would be unlawful.
All content is of a general nature and may not address the specific circumstances of any individual or entity. It is not a substitute for professional advice or services. Any actions you take based on the information provided here are strictly at your own risk. You accept full responsibility for any decisions or outcomes arising from your use of this website and agree to release us from any liability in connection with your use of, or reliance upon, the content or products found herein.