
|
Spirent Communications Plc (SPT.L) Avaliação DCF |
Totalmente Editável: Adapte-Se Às Suas Necessidades No Excel Ou Planilhas
Design Profissional: Modelos Confiáveis E Padrão Da Indústria
Pré-Construídos Para Uso Rápido E Eficiente
Compatível com MAC/PC, totalmente desbloqueado
Não É Necessária Experiência; Fácil De Seguir
Spirent Communications plc (SPT.L) Bundle
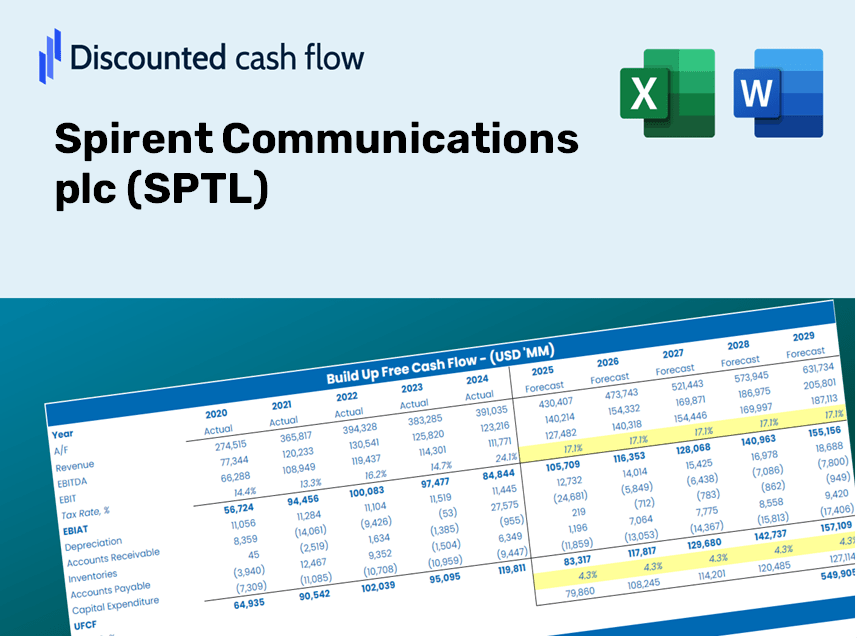
Seja você um investidor ou analista, esta calculadora DCF Spirent Communications PLC (SPTL) é o seu recurso ideal para uma avaliação precisa. Com dados reais da Spirent Communications PLC pré -carregados, você pode ajustar facilmente as previsões e observar instantaneamente os efeitos.
Discounted Cash Flow (DCF) - (USD MM)
| Year | AY1 2020 |
AY2 2021 |
AY3 2022 |
AY4 2023 |
AY5 2024 |
FY1 2025 |
FY2 2026 |
FY3 2027 |
FY4 2028 |
FY5 2029 |
|---|---|---|---|---|---|---|---|---|---|---|
| Revenue | 390.1 | 430.1 | 453.7 | 354.2 | 343.7 | 335.8 | 328.1 | 320.6 | 313.2 | 306.0 |
| Revenue Growth, % | 0 | 10.26 | 5.47 | -21.93 | -2.97 | -2.29 | -2.29 | -2.29 | -2.29 | -2.29 |
| EBITDA | 84.1 | 94.4 | 99.6 | 34.6 | 26.3 | 55.7 | 54.4 | 53.1 | 51.9 | 50.7 |
| EBITDA, % | 21.55 | 21.94 | 21.96 | 9.76 | 7.65 | 16.57 | 16.57 | 16.57 | 16.57 | 16.57 |
| Depreciation | 10.2 | 13.0 | 12.2 | 16.8 | 15.2 | 11.7 | 11.5 | 11.2 | 11.0 | 10.7 |
| Depreciation, % | 2.6 | 3.02 | 2.68 | 4.74 | 4.43 | 3.5 | 3.5 | 3.5 | 3.5 | 3.5 |
| EBIT | 73.9 | 81.4 | 87.4 | 17.8 | 11.1 | 43.9 | 42.9 | 41.9 | 41.0 | 40.0 |
| EBIT, % | 18.95 | 18.92 | 19.28 | 5.02 | 3.22 | 13.08 | 13.08 | 13.08 | 13.08 | 13.08 |
| Total Cash | 180.1 | 130.5 | 156.5 | 80.7 | 105.9 | 110.6 | 108.0 | 105.5 | 103.1 | 100.8 |
| Total Cash, percent | .0 | .0 | .0 | .0 | .0 | .0 | .0 | .0 | .0 | .0 |
| Account Receivables | 88.4 | 111.4 | 106.3 | 90.2 | 92.6 | 83.6 | 81.6 | 79.8 | 77.9 | 76.2 |
| Account Receivables, % | 22.66 | 25.9 | 23.44 | 25.47 | 26.94 | 24.88 | 24.88 | 24.88 | 24.88 | 24.88 |
| Inventories | 16.7 | 19.4 | 29.7 | 32.5 | 26.5 | 21.6 | 21.1 | 20.7 | 20.2 | 19.7 |
| Inventories, % | 4.27 | 4.51 | 6.55 | 9.17 | 7.71 | 6.44 | 6.44 | 6.44 | 6.44 | 6.44 |
| Accounts Payable | 7.0 | 9.6 | 25.1 | 14.4 | 15.8 | 12.3 | 12.0 | 11.7 | 11.4 | 11.2 |
| Accounts Payable, % | 1.8 | 2.24 | 5.53 | 4.07 | 4.61 | 3.65 | 3.65 | 3.65 | 3.65 | 3.65 |
| Capital Expenditure | -7.1 | -7.6 | -6.3 | -4.9 | -8.8 | -6.0 | -5.8 | -5.7 | -5.6 | -5.5 |
| Capital Expenditure, % | -1.82 | -1.77 | -1.38 | -1.37 | -2.56 | -1.78 | -1.78 | -1.78 | -1.78 | -1.78 |
| Tax Rate, % | 6.52 | 6.52 | 6.52 | 6.52 | 6.52 | 6.52 | 6.52 | 6.52 | 6.52 | 6.52 |
| EBITAT | 65.1 | 70.1 | 76.2 | 19.6 | 10.3 | 39.9 | 39.0 | 38.1 | 37.3 | 36.4 |
| Depreciation | ||||||||||
| Changes in Account Receivables | ||||||||||
| Changes in Inventories | ||||||||||
| Changes in Accounts Payable | ||||||||||
| Capital Expenditure | ||||||||||
| UFCF | -29.9 | 52.3 | 92.4 | 34.2 | 21.8 | 56.0 | 46.8 | 45.7 | 44.7 | 43.6 |
| WACC, % | 5.99 | 5.99 | 5.99 | 5.99 | 5.99 | 5.99 | 5.99 | 5.99 | 5.99 | 5.99 |
| PV UFCF | ||||||||||
| SUM PV UFCF | 201.0 | |||||||||
| Long Term Growth Rate, % | 0.50 | |||||||||
| Free cash flow (T + 1) | 44 | |||||||||
| Terminal Value | 799 | |||||||||
| Present Terminal Value | 597 | |||||||||
| Enterprise Value | 798 | |||||||||
| Net Debt | -91 | |||||||||
| Equity Value | 889 | |||||||||
| Diluted Shares Outstanding, MM | 580 | |||||||||
| Equity Value Per Share | 153.41 |
Benefits You Will Receive
- Adjustable Forecast Variables: Easily modify key assumptions (growth %, margins, WACC) to simulate various scenarios.
- Real-Time Data: Spirent Communications plc’s (SPTL) financial information pre-loaded to facilitate your analysis.
- Automated DCF Calculations: The template computes Net Present Value (NPV) and intrinsic value automatically.
- Tailored and Professional: A refined Excel model that aligns with your valuation requirements.
- Designed for Analysts and Investors: Perfect for assessing forecasts, confirming strategies, and enhancing efficiency.
Key Features
- Accurate Financial Data for Spirent: Gain access to precise historical figures and forecasts for Spirent Communications plc (SPTL).
- Tailorable Forecast Assumptions: Modify highlighted cells such as WACC, growth rates, and profit margins.
- Real-Time Calculations: Automatic recalculations for DCF, Net Present Value (NPV), and cash flow evaluations.
- User-Friendly Dashboard: Intuitive charts and summaries to help you understand valuation outcomes at a glance.
- Designed for All Skill Levels: A straightforward and user-friendly layout suitable for investors, CFOs, and consultants alike.
How It Functions
- Download: Obtain the pre-formulated Excel file featuring Spirent Communications plc’s (SPTL) financial data.
- Customize: Tailor forecasts such as revenue growth, EBITDA %, and WACC to your needs.
- Update Instantly: Watch as intrinsic value and NPV calculations refresh in real-time.
- Explore Scenarios: Develop various projections and evaluate results without delay.
- Make Informed Choices: Leverage the valuation findings to shape your investment approach.
Why Choose This Calculator for Spirent Communications plc (SPTL)?
- User-Friendly Interface: Tailored for both novice users and seasoned professionals.
- Customizable Inputs: Modify assumptions easily to suit your analysis needs.
- Real-Time Feedback: Instantly view updates to Spirent's valuation as you change inputs.
- Pre-Loaded Data: Comes with Spirent's actual financial figures for swift assessments.
- Relied Upon by Experts: Trusted by investors and analysts for making well-informed choices.
Who Can Benefit from This Product?
- Investors: Accurately assess the fair value of Spirent Communications plc (SPTL) before finalizing investment choices.
- CFOs: Utilize a sophisticated DCF model for financial analysis and reporting purposes.
- Consultants: Easily modify the template to create valuation reports tailored for clients.
- Entrepreneurs: Acquire insights into the financial modeling techniques employed by leading companies.
- Educators: Employ it as a resource to illustrate various valuation methodologies in the classroom.
Contents of the Template
- Detailed DCF Model: A customizable template featuring in-depth valuation analyses.
- Historical and Projected Data: Spirent Communications' (SPTL) financial information pre-loaded for in-depth examination.
- Adjustable Assumptions: Modify WACC, growth rates, and tax parameters to explore various scenarios.
- Comprehensive Financial Statements: Complete annual and quarterly financial reports for enhanced analysis.
- Important Ratios: Integrated evaluation of profitability, operational efficiency, and financial leverage.
- User-Friendly Dashboard: Visualizations and tables presenting clear and actionable insights.
Disclaimer
All information, articles, and product details provided on this website are for general informational and educational purposes only. We do not claim any ownership over, nor do we intend to infringe upon, any trademarks, copyrights, logos, brand names, or other intellectual property mentioned or depicted on this site. Such intellectual property remains the property of its respective owners, and any references here are made solely for identification or informational purposes, without implying any affiliation, endorsement, or partnership.
We make no representations or warranties, express or implied, regarding the accuracy, completeness, or suitability of any content or products presented. Nothing on this website should be construed as legal, tax, investment, financial, medical, or other professional advice. In addition, no part of this site—including articles or product references—constitutes a solicitation, recommendation, endorsement, advertisement, or offer to buy or sell any securities, franchises, or other financial instruments, particularly in jurisdictions where such activity would be unlawful.
All content is of a general nature and may not address the specific circumstances of any individual or entity. It is not a substitute for professional advice or services. Any actions you take based on the information provided here are strictly at your own risk. You accept full responsibility for any decisions or outcomes arising from your use of this website and agree to release us from any liability in connection with your use of, or reliance upon, the content or products found herein.