
|
Sequens comunicações S.A. (SQNS) DCF Avaliação |
Totalmente Editável: Adapte-Se Às Suas Necessidades No Excel Ou Planilhas
Design Profissional: Modelos Confiáveis E Padrão Da Indústria
Pré-Construídos Para Uso Rápido E Eficiente
Compatível com MAC/PC, totalmente desbloqueado
Não É Necessária Experiência; Fácil De Seguir
Sequans Communications S.A. (SQNS) Bundle
Atualize sua análise e melhore a precisão com a nossa calculadora DCF (SQNS)! Com o acesso a seqüens comunicações S.A. Dados e suposições personalizáveis, essa ferramenta o capacita a prever, analisar e sequências de valor como um investidor experiente.
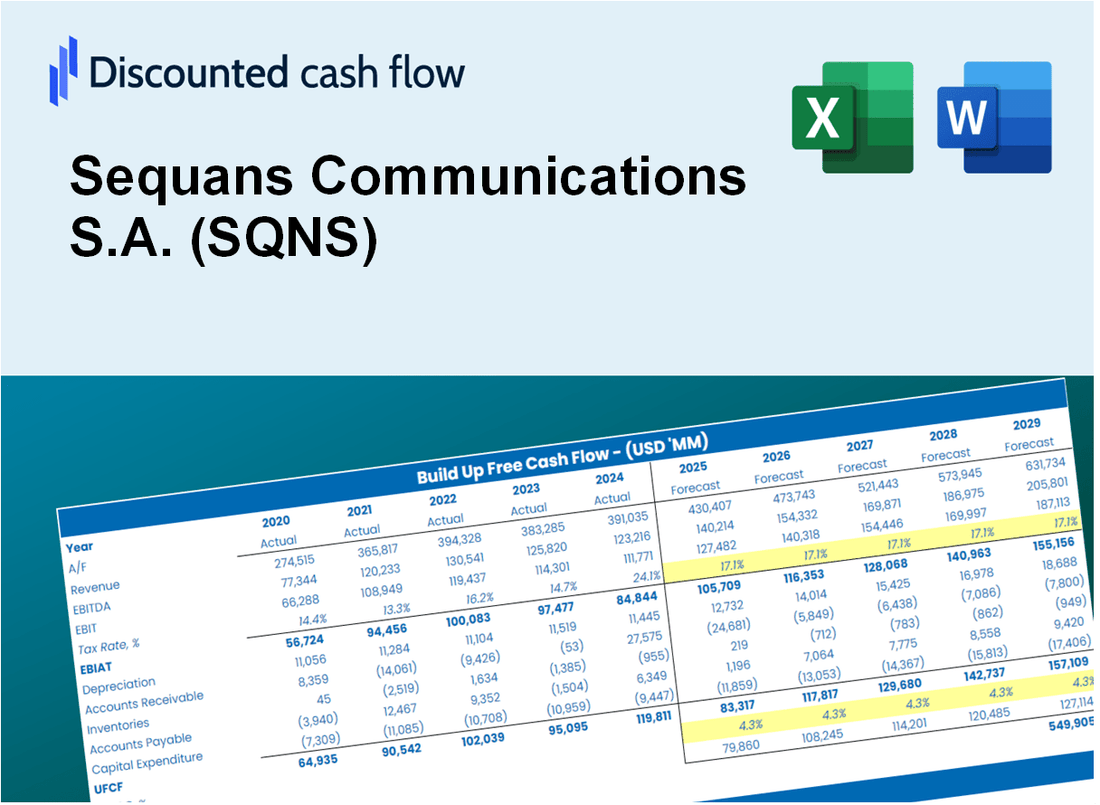
Discounted Cash Flow (DCF) - (USD MM)
| Year | AY1 2020 |
AY2 2021 |
AY3 2022 |
AY4 2023 |
AY5 2024 |
FY1 2025 |
FY2 2026 |
FY3 2027 |
FY4 2028 |
FY5 2029 |
|---|---|---|---|---|---|---|---|---|---|---|
| Revenue | 50.9 | 50.9 | 60.6 | 33.6 | 36.8 | 35.4 | 33.9 | 32.6 | 31.3 | 30.0 |
| Revenue Growth, % | 0 | -0.07266871 | 19.01 | -44.48 | 9.56 | -4 | -4 | -4 | -4 | -4 |
| EBITDA | -29.9 | 1.5 | 15.7 | -15.9 | 148.1 | 1.6 | 1.5 | 1.5 | 1.4 | 1.4 |
| EBITDA, % | -58.8 | 2.88 | 25.86 | -47.33 | 402.23 | 4.52 | 4.52 | 4.52 | 4.52 | 4.52 |
| Depreciation | 9.8 | 10.6 | 12.0 | 11.9 | 64.0 | 13.8 | 13.3 | 12.7 | 12.2 | 11.7 |
| Depreciation, % | 19.19 | 20.74 | 19.84 | 35.52 | 173.88 | 39.06 | 39.06 | 39.06 | 39.06 | 39.06 |
| EBIT | -39.7 | -9.1 | 3.6 | -27.9 | 84.1 | -5.1 | -4.9 | -4.7 | -4.5 | -4.4 |
| EBIT, % | -77.99 | -17.86 | 6.02 | -82.85 | 228.34 | -14.54 | -14.54 | -14.54 | -14.54 | -14.54 |
| Total Cash | 7.6 | 4.8 | 10.7 | 5.7 | 62.1 | 11.2 | 10.8 | 10.4 | 9.9 | 9.6 |
| Total Cash, percent | .0 | .0 | .0 | .0 | .0 | .0 | .0 | .0 | .0 | .0 |
| Account Receivables | 26.0 | 27.5 | 19.0 | 23.4 | 26.6 | 19.7 | 18.9 | 18.2 | 17.4 | 16.7 |
| Account Receivables, % | 51.11 | 54.1 | 31.35 | 69.71 | 72.24 | 55.7 | 55.7 | 55.7 | 55.7 | 55.7 |
| Inventories | 6.2 | 6.4 | 9.4 | 6.3 | 2.9 | 4.7 | 4.6 | 4.4 | 4.2 | 4.0 |
| Inventories, % | 12.23 | 12.64 | 15.5 | 18.85 | 7.8 | 13.4 | 13.4 | 13.4 | 13.4 | 13.4 |
| Accounts Payable | 15.7 | 13.9 | 9.3 | 16.3 | 6.1 | 9.8 | 9.4 | 9.0 | 8.7 | 8.3 |
| Accounts Payable, % | 30.84 | 27.35 | 15.43 | 48.43 | 16.58 | 27.73 | 27.73 | 27.73 | 27.73 | 27.73 |
| Capital Expenditure | -13.8 | -28.9 | -22.7 | -29.6 | -19.7 | -18.6 | -17.8 | -17.1 | -16.5 | -15.8 |
| Capital Expenditure, % | -27.05 | -56.84 | -37.43 | -87.97 | -53.61 | -52.58 | -52.58 | -52.58 | -52.58 | -52.58 |
| Tax Rate, % | 5.79 | 5.79 | 5.79 | 5.79 | 5.79 | 5.79 | 5.79 | 5.79 | 5.79 | 5.79 |
| EBITAT | -40.4 | -9.4 | 5.2 | -29.8 | 79.2 | -5.1 | -4.9 | -4.7 | -4.5 | -4.3 |
| Depreciation | ||||||||||
| Changes in Account Receivables | ||||||||||
| Changes in Inventories | ||||||||||
| Changes in Accounts Payable | ||||||||||
| Capital Expenditure | ||||||||||
| UFCF | -61.0 | -31.2 | -4.4 | -41.9 | 113.6 | -1.1 | -8.9 | -8.5 | -8.2 | -7.9 |
| WACC, % | 127.39 | 127.39 | 127.39 | 127.39 | 120.05 | 125.92 | 125.92 | 125.92 | 125.92 | 125.92 |
| PV UFCF | ||||||||||
| SUM PV UFCF | -3.4 | |||||||||
| Long Term Growth Rate, % | 2.00 | |||||||||
| Free cash flow (T + 1) | -8 | |||||||||
| Terminal Value | -6 | |||||||||
| Present Terminal Value | 0 | |||||||||
| Enterprise Value | -4 | |||||||||
| Net Debt | 7 | |||||||||
| Equity Value | -11 | |||||||||
| Diluted Shares Outstanding, MM | 0 | |||||||||
| Equity Value Per Share | -38.01 |
What You Will Get
- Pre-Filled Financial Model: Sequans Communications’ actual data allows for accurate DCF valuation.
- Full Forecast Control: Modify revenue growth, profit margins, WACC, and other critical drivers.
- Instant Calculations: Automatic updates provide real-time results as you adjust inputs.
- Investor-Ready Template: A polished Excel file crafted for high-quality valuation presentations.
- Customizable and Reusable: Designed for versatility, enabling repeated use for comprehensive forecasts.
Key Features
- Comprehensive Data: Sequans Communications’ historical financial statements and pre-filled projections.
- Customizable Parameters: Adjust WACC, tax rates, revenue growth, and EBITDA margins as needed.
- Real-Time Insights: View Sequans’ intrinsic value recalculating instantly.
- Intuitive Visualizations: Dashboard charts illustrate valuation results and critical metrics.
- Designed for Precision: A professional-grade tool for analysts, investors, and finance professionals.
How It Works
- Step 1: Download the prebuilt Excel template featuring Sequans Communications S.A. (SQNS) data.
- Step 2: Review the pre-filled sheets to familiarize yourself with the essential metrics.
- Step 3: Modify forecasts and assumptions in the editable yellow cells (WACC, growth, margins).
- Step 4: Immediately view updated results, including Sequans Communications S.A. (SQNS) intrinsic value.
- Step 5: Make informed investment choices or create reports based on the generated outputs.
Why Choose This Calculator for Sequans Communications (SQNS)?
- Designed for Industry Experts: A sophisticated tool tailored for analysts, CFOs, and consultants in the tech sector.
- Accurate Financials: Sequans’ historical and projected financial data preloaded for precise analysis.
- Flexible Scenario Analysis: Effortlessly simulate various forecasts and assumptions.
- Comprehensive Outputs: Instantly calculates intrinsic value, NPV, and essential financial metrics.
- User-Friendly Interface: Clear, step-by-step guidance to help you navigate the tool effortlessly.
Who Should Use This Product?
- Professional Investors: Develop comprehensive and accurate valuation models for in-depth portfolio assessment of Sequans Communications (SQNS).
- Corporate Finance Teams: Evaluate valuation scenarios to inform strategic decisions within the organization.
- Consultants and Advisors: Deliver precise valuation insights to clients interested in Sequans Communications (SQNS) stock.
- Students and Educators: Utilize real market data to enhance learning and practice in financial modeling.
- Tech Enthusiasts: Gain insights into how telecommunications companies like Sequans Communications (SQNS) are valued in the industry.
What the Template Contains
- Operating and Balance Sheet Data: Pre-filled Sequans Communications historical data and forecasts, including revenue, EBITDA, EBIT, and capital expenditures.
- WACC Calculation: A dedicated sheet for Weighted Average Cost of Capital (WACC), featuring parameters like Beta, risk-free rate, and share price.
- DCF Valuation (Unlevered and Levered): Editable Discounted Cash Flow models demonstrating intrinsic value with comprehensive calculations.
- Financial Statements: Pre-loaded financial statements (annual and quarterly) to facilitate analysis.
- Key Ratios: Includes profitability, leverage, and efficiency ratios for Sequans Communications.
- Dashboard and Charts: Visual summary of valuation outputs and assumptions for easy result analysis.
Disclaimer
All information, articles, and product details provided on this website are for general informational and educational purposes only. We do not claim any ownership over, nor do we intend to infringe upon, any trademarks, copyrights, logos, brand names, or other intellectual property mentioned or depicted on this site. Such intellectual property remains the property of its respective owners, and any references here are made solely for identification or informational purposes, without implying any affiliation, endorsement, or partnership.
We make no representations or warranties, express or implied, regarding the accuracy, completeness, or suitability of any content or products presented. Nothing on this website should be construed as legal, tax, investment, financial, medical, or other professional advice. In addition, no part of this site—including articles or product references—constitutes a solicitation, recommendation, endorsement, advertisement, or offer to buy or sell any securities, franchises, or other financial instruments, particularly in jurisdictions where such activity would be unlawful.
All content is of a general nature and may not address the specific circumstances of any individual or entity. It is not a substitute for professional advice or services. Any actions you take based on the information provided here are strictly at your own risk. You accept full responsibility for any decisions or outcomes arising from your use of this website and agree to release us from any liability in connection with your use of, or reliance upon, the content or products found herein.