
|
Avaliação DCF de Energia Sempra (SREA) |
Totalmente Editável: Adapte-Se Às Suas Necessidades No Excel Ou Planilhas
Design Profissional: Modelos Confiáveis E Padrão Da Indústria
Pré-Construídos Para Uso Rápido E Eficiente
Compatível com MAC/PC, totalmente desbloqueado
Não É Necessária Experiência; Fácil De Seguir
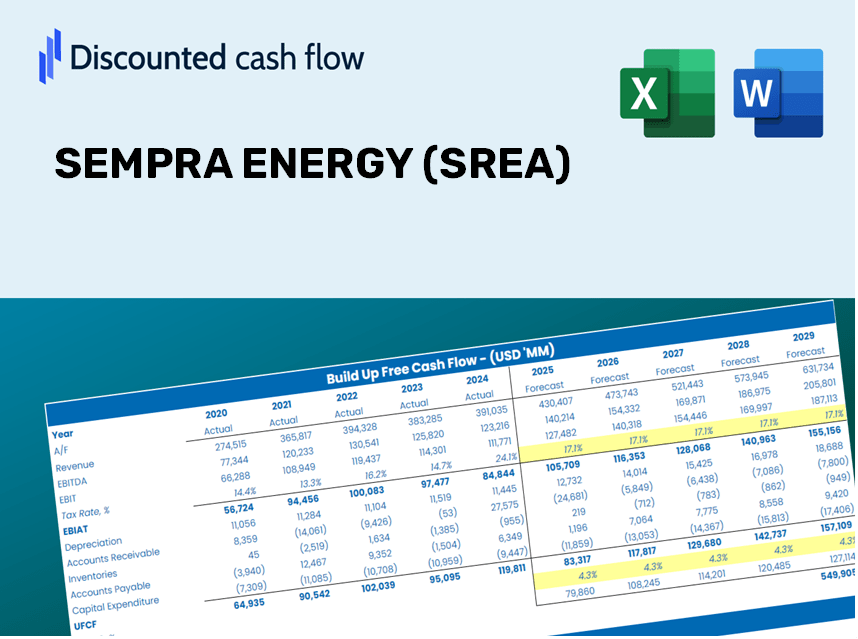
Sempra Energy (SREA) Bundle
Projetado para precisão, nossa calculadora DCF da Sempra Energy (SREA) permite avaliar a avaliação da ENERPRA Energy usando dados financeiros em tempo real e oferece flexibilidade completa para modificar todos os parâmetros essenciais para projeções aprimoradas.
Discounted Cash Flow (DCF) - (USD MM)
| Year | AY1 2020 |
AY2 2021 |
AY3 2022 |
AY4 2023 |
AY5 2024 |
FY1 2025 |
FY2 2026 |
FY3 2027 |
FY4 2028 |
FY5 2029 |
|---|---|---|---|---|---|---|---|---|---|---|
| Revenue | 11,370.0 | 12,857.0 | 14,439.0 | 16,720.0 | 13,185.0 | 13,845.5 | 14,539.1 | 15,267.4 | 16,032.3 | 16,835.4 |
| Revenue Growth, % | 0 | 13.08 | 12.3 | 15.8 | -21.14 | 5.01 | 5.01 | 5.01 | 5.01 | 5.01 |
| EBITDA | 4,226.0 | 3,260.0 | 4,417.0 | 5,836.0 | -205.0 | 3,501.9 | 3,677.3 | 3,861.6 | 4,055.0 | 4,258.1 |
| EBITDA, % | 37.17 | 25.36 | 30.59 | 34.9 | -1.55 | 25.29 | 25.29 | 25.29 | 25.29 | 25.29 |
| Depreciation | 1,666.0 | 1,855.0 | 2,019.0 | 2,227.0 | -2,437.0 | 1,049.5 | 1,102.1 | 1,157.3 | 1,215.2 | 1,276.1 |
| Depreciation, % | 14.65 | 14.43 | 13.98 | 13.32 | -18.48 | 7.58 | 7.58 | 7.58 | 7.58 | 7.58 |
| EBIT | 2,560.0 | 1,405.0 | 2,398.0 | 3,609.0 | 2,232.0 | 2,452.4 | 2,575.3 | 2,704.3 | 2,839.8 | 2,982.0 |
| EBIT, % | 22.52 | 10.93 | 16.61 | 21.58 | 16.93 | 17.71 | 17.71 | 17.71 | 17.71 | 17.71 |
| Total Cash | 982.0 | 578.0 | 410.0 | 285.0 | 1,586.0 | 822.6 | 863.8 | 907.0 | 952.5 | 1,000.2 |
| Total Cash, percent | .0 | .0 | .0 | .0 | .0 | .0 | .0 | .0 | .0 | .0 |
| Account Receivables | 2,114.0 | 2,571.0 | 3,487.0 | 2,837.0 | 2,483.0 | 2,728.7 | 2,865.3 | 3,008.9 | 3,159.6 | 3,317.9 |
| Account Receivables, % | 18.59 | 20 | 24.15 | 16.97 | 18.83 | 19.71 | 19.71 | 19.71 | 19.71 | 19.71 |
| Inventories | 308.0 | 389.0 | 403.0 | 482.0 | 559.0 | 433.3 | 455.0 | 477.8 | 501.7 | 526.9 |
| Inventories, % | 2.71 | 3.03 | 2.79 | 2.88 | 4.24 | 3.13 | 3.13 | 3.13 | 3.13 | 3.13 |
| Accounts Payable | 1,359.0 | 1,671.0 | 1,994.0 | 2,211.0 | 2,238.0 | 1,909.5 | 2,005.1 | 2,105.6 | 2,211.1 | 2,321.8 |
| Accounts Payable, % | 11.95 | 13 | 13.81 | 13.22 | 16.97 | 13.79 | 13.79 | 13.79 | 13.79 | 13.79 |
| Capital Expenditure | -4,676.0 | -5,015.0 | -5,357.0 | -8,397.0 | -8,215.0 | -6,362.3 | -6,681.0 | -7,015.7 | -7,367.1 | -7,736.2 |
| Capital Expenditure, % | -41.13 | -39.01 | -37.1 | -50.22 | -62.31 | -45.95 | -45.95 | -45.95 | -45.95 | -45.95 |
| Tax Rate, % | -35.64 | -35.64 | -35.64 | -35.64 | -35.64 | -35.64 | -35.64 | -35.64 | -35.64 | -35.64 |
| EBITAT | 4,021.5 | 1,316.8 | 664.5 | 2,701.3 | 3,027.5 | 1,943.7 | 2,041.1 | 2,143.3 | 2,250.7 | 2,363.4 |
| Depreciation | ||||||||||
| Changes in Account Receivables | ||||||||||
| Changes in Inventories | ||||||||||
| Changes in Accounts Payable | ||||||||||
| Capital Expenditure | ||||||||||
| UFCF | -51.5 | -2,069.2 | -3,280.5 | -2,680.7 | -7,320.5 | -3,817.6 | -3,600.6 | -3,781.0 | -3,970.4 | -4,169.3 |
| WACC, % | 4.62 | 4.45 | 2.7 | 3.95 | 4.62 | 4.07 | 4.07 | 4.07 | 4.07 | 4.07 |
| PV UFCF | ||||||||||
| SUM PV UFCF | -17,147.5 | |||||||||
| Long Term Growth Rate, % | 2.00 | |||||||||
| Free cash flow (T + 1) | -4,253 | |||||||||
| Terminal Value | -205,471 | |||||||||
| Present Terminal Value | -168,317 | |||||||||
| Enterprise Value | -185,465 | |||||||||
| Net Debt | 34,546 | |||||||||
| Equity Value | -220,011 | |||||||||
| Diluted Shares Outstanding, MM | 634 | |||||||||
| Equity Value Per Share | -347.13 |
Benefits You Will Receive
- Customizable Excel Template: A comprehensive and editable DCF Calculator in Excel featuring pre-filled financial data for SEMPRA ENERGY (SREA).
- Accurate Historical Data: Access to historical performance data and future estimates (indicated in the highlighted cells).
- Flexible Forecasting: Adjust key assumptions such as revenue growth, EBITDA percentage, and WACC to fit your analysis.
- Real-Time Calculations: Instantly observe how your variable inputs affect the valuation of SEMPRA ENERGY (SREA).
- Professional-Grade Tool: Designed specifically for investors, CFOs, consultants, and financial analysts.
- Intuitive User Interface: Organized for simplicity and usability, complete with detailed step-by-step guidance.
Key Features
- Customizable Forecast Inputs: Adjust essential metrics such as revenue growth, EBITDA %, and capital expenses specific to SEMPRA ENERGY (SREA).
- Instant DCF Valuation: Quickly derive intrinsic value, NPV, and additional financial metrics.
- Highly Accurate Projections: Incorporates SEMPRA ENERGY's (SREA) actual financial data for reliable valuation results.
- Effortless Scenario Analysis: Easily explore various assumptions and evaluate their impacts.
- Time-Efficient Solution: Avoid the hassle of constructing intricate valuation models from the ground up.
How SEMPRA ENERGY Works
- Step 1: Download the Excel spreadsheet.
- Step 2: Review Sempra Energy's pre-filled financial data and projections.
- Step 3: Adjust key inputs such as revenue growth, WACC, and tax rates (highlighted cells).
- Step 4: Observe the DCF model update in real-time as you modify your assumptions.
- Step 5: Evaluate the results and utilize the findings for informed investment choices.
Why Select This Calculator for SEMPRA ENERGY (SREA)?
- User-Friendly Interface: Tailored for both novices and seasoned professionals.
- Customizable Inputs: Effortlessly adjust parameters to fit your specific analysis.
- Real-Time Updates: Observe immediate changes in Sempra Energy's valuation as you modify inputs.
- Preconfigured for Convenience: Comes with Sempra Energy’s latest financial information for swift assessments.
- Recommended by Industry Experts: Utilized by investors and analysts for making well-informed choices.
Who Can Benefit from This Product?
- Institutional Investors: Develop comprehensive and accurate valuation models for analyzing Sempra Energy's performance.
- Corporate Finance Departments: Evaluate valuation scenarios to inform strategic decision-making within the organization.
- Advisors and Consultants: Equip clients with precise valuation insights for Sempra Energy (SREA) stock.
- Students and Educators: Leverage real market data for hands-on practice and teaching in financial modeling.
- Energy Sector Enthusiasts: Gain insights into the valuation processes for energy companies like Sempra Energy (SREA).
Contents of the Template
- Operating and Balance Sheet Data: Pre-populated historical data and projections for Sempra Energy (SREA), featuring revenue, EBITDA, EBIT, and capital expenditures.
- WACC Calculation: A specialized sheet for calculating Weighted Average Cost of Capital (WACC), including key inputs such as Beta, risk-free rate, and share price.
- DCF Valuation (Unlevered and Levered): Customizable Discounted Cash Flow models that reveal intrinsic value with comprehensive calculations.
- Financial Statements: Pre-loaded annual and quarterly financial statements to facilitate in-depth analysis.
- Key Ratios: A set of critical ratios including profitability, leverage, and efficiency specifically for Sempra Energy (SREA).
- Dashboard and Charts: A visual overview of valuation results and assumptions for straightforward analysis.
Disclaimer
All information, articles, and product details provided on this website are for general informational and educational purposes only. We do not claim any ownership over, nor do we intend to infringe upon, any trademarks, copyrights, logos, brand names, or other intellectual property mentioned or depicted on this site. Such intellectual property remains the property of its respective owners, and any references here are made solely for identification or informational purposes, without implying any affiliation, endorsement, or partnership.
We make no representations or warranties, express or implied, regarding the accuracy, completeness, or suitability of any content or products presented. Nothing on this website should be construed as legal, tax, investment, financial, medical, or other professional advice. In addition, no part of this site—including articles or product references—constitutes a solicitation, recommendation, endorsement, advertisement, or offer to buy or sell any securities, franchises, or other financial instruments, particularly in jurisdictions where such activity would be unlawful.
All content is of a general nature and may not address the specific circumstances of any individual or entity. It is not a substitute for professional advice or services. Any actions you take based on the information provided here are strictly at your own risk. You accept full responsibility for any decisions or outcomes arising from your use of this website and agree to release us from any liability in connection with your use of, or reliance upon, the content or products found herein.