|
Strata Skin Sciences, Inc. (SSKN) Avaliação DCF |
Totalmente Editável: Adapte-Se Às Suas Necessidades No Excel Ou Planilhas
Design Profissional: Modelos Confiáveis E Padrão Da Indústria
Pré-Construídos Para Uso Rápido E Eficiente
Compatível com MAC/PC, totalmente desbloqueado
Não É Necessária Experiência; Fácil De Seguir
STRATA Skin Sciences, Inc. (SSKN) Bundle
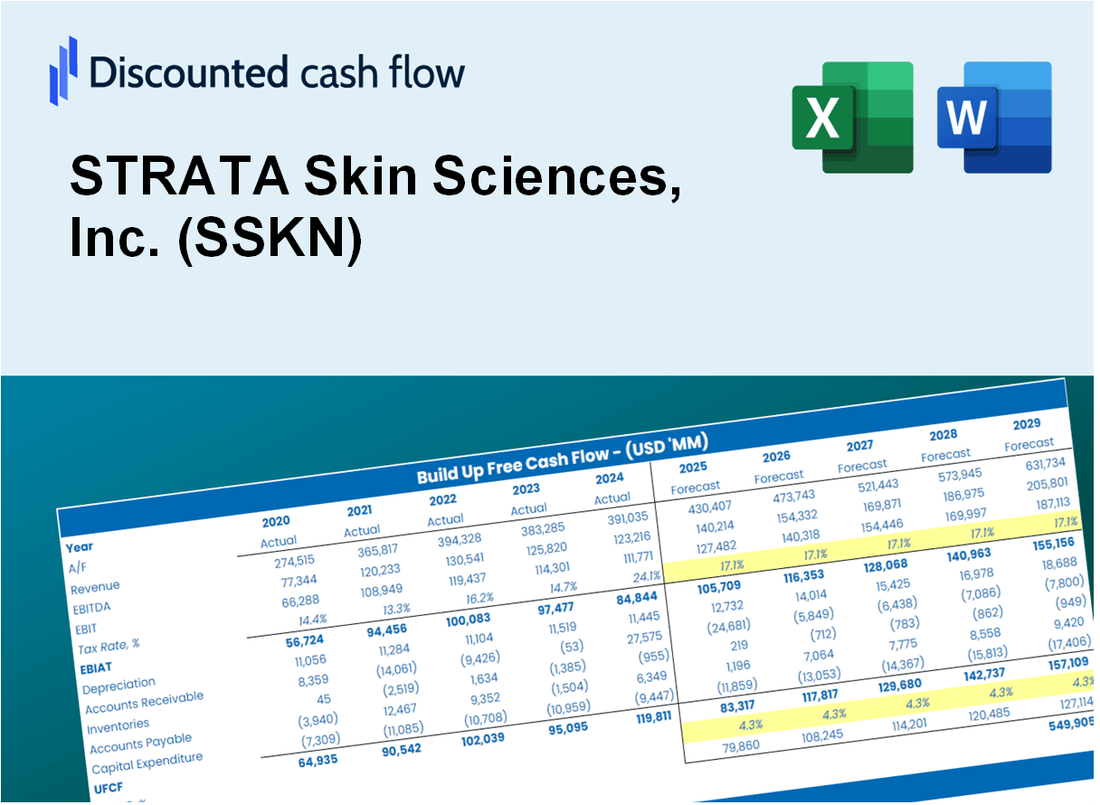
Simplifique a avaliação do Strata Skin Sciences, Inc. (SSKN) com esta calculadora DCF personalizável! Apresentando o Strata Skin Sciences, Inc. (SSKN) e os insumos de previsão ajustáveis, você pode testar cenários e descobrir o valor justo do Strata Skin Sciences, Inc. (SSKN) em minutos.
Discounted Cash Flow (DCF) - (USD MM)
| Year | AY1 2020 |
AY2 2021 |
AY3 2022 |
AY4 2023 |
AY5 2024 |
FY1 2025 |
FY2 2026 |
FY3 2027 |
FY4 2028 |
FY5 2029 |
|---|---|---|---|---|---|---|---|---|---|---|
| Revenue | 23.1 | 30.0 | 36.2 | 33.4 | 33.6 | 37.2 | 41.2 | 45.7 | 50.6 | 56.1 |
| Revenue Growth, % | 0 | 29.83 | 20.63 | -7.75 | 0.61155 | 10.83 | 10.83 | 10.83 | 10.83 | 10.83 |
| EBITDA | -.2 | 1.7 | 1.1 | -3.4 | -2.8 | -.8 | -.9 | -1.0 | -1.1 | -1.2 |
| EBITDA, % | -0.71459 | 5.76 | 3.12 | -10.13 | -8.47 | -2.09 | -2.09 | -2.09 | -2.09 | -2.09 |
| Depreciation | 3.9 | 4.1 | 5.7 | 5.9 | 5.3 | 5.9 | 6.6 | 7.3 | 8.1 | 9.0 |
| Depreciation, % | 16.94 | 13.63 | 15.73 | 17.69 | 15.81 | 15.96 | 15.96 | 15.96 | 15.96 | 15.96 |
| EBIT | -4.1 | -2.4 | -4.6 | -9.3 | -8.1 | -6.7 | -7.4 | -8.2 | -9.1 | -10.1 |
| EBIT, % | -17.65 | -7.87 | -12.61 | -27.83 | -24.28 | -18.05 | -18.05 | -18.05 | -18.05 | -18.05 |
| Total Cash | 10.6 | 12.6 | 5.4 | 6.8 | 7.3 | 10.8 | 11.9 | 13.2 | 14.7 | 16.3 |
| Total Cash, percent | .0 | .0 | .0 | .0 | .0 | .0 | .0 | .0 | .0 | .0 |
| Account Receivables | 2.9 | 3.4 | 4.5 | 4.4 | 5.3 | 4.9 | 5.4 | 6.0 | 6.6 | 7.4 |
| Account Receivables, % | 12.75 | 11.45 | 12.36 | 13.31 | 15.65 | 13.11 | 13.11 | 13.11 | 13.11 | 13.11 |
| Inventories | 3.4 | 3.5 | 3.1 | 2.7 | 2.2 | 3.7 | 4.1 | 4.6 | 5.0 | 5.6 |
| Inventories, % | 14.92 | 11.64 | 8.56 | 8.01 | 6.69 | 9.96 | 9.96 | 9.96 | 9.96 | 9.96 |
| Accounts Payable | 2.8 | 2.8 | 3.4 | 3.3 | 2.4 | 3.6 | 4.0 | 4.4 | 4.9 | 5.4 |
| Accounts Payable, % | 11.97 | 9.41 | 9.47 | 10.02 | 7.25 | 9.63 | 9.63 | 9.63 | 9.63 | 9.63 |
| Capital Expenditure | -2.2 | -3.7 | -3.6 | -5.0 | -1.6 | -3.8 | -4.2 | -4.7 | -5.2 | -5.8 |
| Capital Expenditure, % | -9.35 | -12.19 | -9.82 | -15.05 | -4.87 | -10.26 | -10.26 | -10.26 | -10.26 | -10.26 |
| Tax Rate, % | 1.66 | 1.66 | 1.66 | 1.66 | 1.66 | 1.66 | 1.66 | 1.66 | 1.66 | 1.66 |
| EBITAT | -4.3 | -2.4 | -4.6 | -9.2 | -8.0 | -6.7 | -7.4 | -8.2 | -9.1 | -10.1 |
| Depreciation | ||||||||||
| Changes in Account Receivables | ||||||||||
| Changes in Inventories | ||||||||||
| Changes in Accounts Payable | ||||||||||
| Capital Expenditure | ||||||||||
| UFCF | -6.2 | -2.4 | -2.5 | -7.9 | -5.6 | -4.5 | -5.6 | -6.2 | -6.9 | -7.6 |
| WACC, % | 7.25 | 7.25 | 7.25 | 7.23 | 7.21 | 7.23 | 7.23 | 7.23 | 7.23 | 7.23 |
| PV UFCF | ||||||||||
| SUM PV UFCF | -24.6 | |||||||||
| Long Term Growth Rate, % | 2.00 | |||||||||
| Free cash flow (T + 1) | -8 | |||||||||
| Terminal Value | -148 | |||||||||
| Present Terminal Value | -105 | |||||||||
| Enterprise Value | -129 | |||||||||
| Net Debt | 9 | |||||||||
| Equity Value | -138 | |||||||||
| Diluted Shares Outstanding, MM | 38 | |||||||||
| Equity Value Per Share | -3.64 |
What You Will Get
- Real SSKN Financial Data: Pre-filled with STRATA Skin Sciences’ historical and projected data for precise analysis.
- Fully Editable Template: Modify key inputs like revenue growth, WACC, and EBITDA % with ease.
- Automatic Calculations: See STRATA Skin Sciences’ intrinsic value update instantly based on your changes.
- Professional Valuation Tool: Designed for investors, analysts, and consultants seeking accurate DCF results.
- User-Friendly Design: Simple structure and clear instructions for all experience levels.
Key Features
- Comprehensive DCF Tool: Features detailed unlevered and levered DCF valuation models tailored for STRATA Skin Sciences, Inc. (SSKN).
- WACC Analysis Tool: Pre-configured Weighted Average Cost of Capital sheet with adjustable parameters.
- Customizable Forecast Inputs: Adjust growth projections, capital investments, and discount rates as needed.
- Integrated Financial Ratios: Evaluate profitability, leverage, and efficiency ratios specific to STRATA Skin Sciences, Inc. (SSKN).
- Interactive Dashboard and Charts: Visual representations that condense key valuation metrics for straightforward analysis.
How It Works
- Step 1: Download the Excel file for STRATA Skin Sciences, Inc. (SSKN).
- Step 2: Review STRATA's pre-filled financial data and forecasts.
- Step 3: Adjust key inputs such as revenue growth, WACC, and tax rates (highlighted cells).
- Step 4: Observe the DCF model update in real-time as you modify assumptions.
- Step 5: Evaluate the outputs and leverage the results for your investment strategies.
Why Choose STRATA Skin Sciences Calculator?
- Precision: Utilizes real STRATA financial data for reliable results.
- Adaptability: Built to allow users to easily adjust and experiment with inputs.
- Efficiency: Avoid the complexity of creating a financial model from the ground up.
- Expert-Level: Crafted with the accuracy and functionality expected by financial professionals.
- Intuitive: Simple to navigate, even for users without extensive financial modeling skills.
Who Should Use This Product?
- Investors: Evaluate STRATA Skin Sciences, Inc.'s (SSKN) market potential before making investment decisions.
- CFOs and Financial Analysts: Enhance financial assessments and project future valuations for SSKN.
- Startup Founders: Understand the valuation methodologies applied to companies like STRATA Skin Sciences, Inc. (SSKN).
- Consultants: Prepare comprehensive valuation reports for clients interested in SSKN.
- Students and Educators: Utilize real data from STRATA Skin Sciences, Inc. (SSKN) to teach and practice valuation strategies.
What the Template Contains
- Preloaded SSKN Data: Historical and projected financial data, including revenue, EBIT, and capital expenditures.
- DCF and WACC Models: Professional-grade sheets for calculating intrinsic value and Weighted Average Cost of Capital.
- Editable Inputs: Yellow-highlighted cells for adjusting revenue growth, tax rates, and discount rates.
- Financial Statements: Comprehensive annual and quarterly financials for deeper analysis.
- Key Ratios: Profitability, leverage, and efficiency ratios to evaluate performance.
- Dashboard and Charts: Visual summaries of valuation outcomes and assumptions.
Disclaimer
All information, articles, and product details provided on this website are for general informational and educational purposes only. We do not claim any ownership over, nor do we intend to infringe upon, any trademarks, copyrights, logos, brand names, or other intellectual property mentioned or depicted on this site. Such intellectual property remains the property of its respective owners, and any references here are made solely for identification or informational purposes, without implying any affiliation, endorsement, or partnership.
We make no representations or warranties, express or implied, regarding the accuracy, completeness, or suitability of any content or products presented. Nothing on this website should be construed as legal, tax, investment, financial, medical, or other professional advice. In addition, no part of this site—including articles or product references—constitutes a solicitation, recommendation, endorsement, advertisement, or offer to buy or sell any securities, franchises, or other financial instruments, particularly in jurisdictions where such activity would be unlawful.
All content is of a general nature and may not address the specific circumstances of any individual or entity. It is not a substitute for professional advice or services. Any actions you take based on the information provided here are strictly at your own risk. You accept full responsibility for any decisions or outcomes arising from your use of this website and agree to release us from any liability in connection with your use of, or reliance upon, the content or products found herein.