
|
Staffing 360 Solutions, Inc. (STAF) Avaliação DCF |
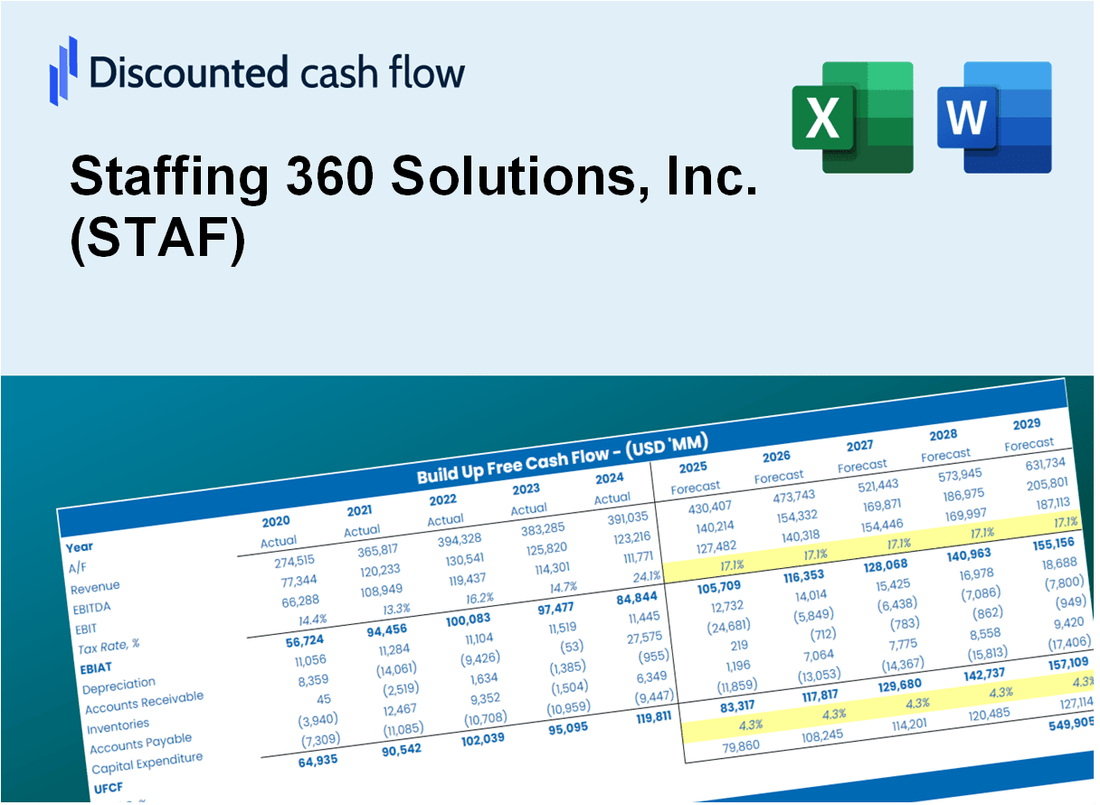
Totalmente Editável: Adapte-Se Às Suas Necessidades No Excel Ou Planilhas
Design Profissional: Modelos Confiáveis E Padrão Da Indústria
Pré-Construídos Para Uso Rápido E Eficiente
Compatível com MAC/PC, totalmente desbloqueado
Não É Necessária Experiência; Fácil De Seguir
Staffing 360 Solutions, Inc. (STAF) Bundle
Procurando determinar o valor intrínseco da Staffing 360 Solutions, Inc.? Nossa calculadora DCF (STAF) integra dados do mundo real e fornece opções extensas de personalização, permitindo refinar suas previsões e aprimorar suas estratégias de investimento.
Discounted Cash Flow (DCF) - (USD MM)
| Year | AY1 2019 |
AY2 2020 |
AY3 2021 |
AY4 2022 |
AY5 2023 |
FY1 2024 |
FY2 2025 |
FY3 2026 |
FY4 2027 |
FY5 2028 |
|---|---|---|---|---|---|---|---|---|---|---|
| Revenue | 278.5 | 204.5 | 197.8 | 244.9 | 190.9 | 177.5 | 165.0 | 153.4 | 142.7 | 132.6 |
| Revenue Growth, % | 0 | -26.56 | -3.3 | 23.84 | -22.07 | -7.02 | -7.02 | -7.02 | -7.02 | -7.02 |
| EBITDA | 4.0 | -3.3 | 16.1 | 2.3 | -8.0 | 1.7 | 1.5 | 1.4 | 1.3 | 1.2 |
| EBITDA, % | 1.43 | -1.64 | 8.13 | 0.94277 | -4.21 | 0.93034 | 0.93034 | 0.93034 | 0.93034 | 0.93034 |
| Depreciation | 3.4 | 4.6 | 4.1 | 3.3 | 3.2 | 3.0 | 2.8 | 2.6 | 2.4 | 2.3 |
| Depreciation, % | 1.21 | 2.27 | 2.05 | 1.37 | 1.69 | 1.72 | 1.72 | 1.72 | 1.72 | 1.72 |
| EBIT | .6 | -8.0 | 12.0 | -1.0 | -11.3 | -1.4 | -1.3 | -1.2 | -1.1 | -1.0 |
| EBIT, % | 0.22372 | -3.91 | 6.08 | -0.42463 | -5.9 | -0.78619 | -0.78619 | -0.78619 | -0.78619 | -0.78619 |
| Total Cash | 1.2 | 8.3 | 4.6 | 2.0 | .7 | 2.8 | 2.6 | 2.4 | 2.3 | 2.1 |
| Total Cash, percent | .0 | .0 | .0 | .0 | .0 | .0 | .0 | .0 | .0 | .0 |
| Account Receivables | 26.6 | 24.6 | 20.7 | 21.3 | 17.8 | 17.8 | 16.5 | 15.4 | 14.3 | 13.3 |
| Account Receivables, % | 9.55 | 12.01 | 10.48 | 8.7 | 9.32 | 10.01 | 10.01 | 10.01 | 10.01 | 10.01 |
| Inventories | .0 | .0 | .0 | .0 | .0 | .0 | .0 | .0 | .0 | .0 |
| Inventories, % | 0.000000359 | 0.000000489 | 0.000000506 | 0 | 0 | 0.000000271 | 0.000000271 | 0.000000271 | 0.000000271 | 0.000000271 |
| Accounts Payable | 1.4 | .0 | 2.7 | 4.1 | 4.6 | 2.1 | 2.0 | 1.9 | 1.7 | 1.6 |
| Accounts Payable, % | 0.50704 | 0.01369012 | 1.39 | 1.69 | 2.43 | 1.21 | 1.21 | 1.21 | 1.21 | 1.21 |
| Capital Expenditure | -.5 | -.3 | -.2 | -.8 | -.3 | -.3 | -.3 | -.3 | -.3 | -.2 |
| Capital Expenditure, % | -0.18314 | -0.12566 | -0.1259 | -0.32501 | -0.16765 | -0.18547 | -0.18547 | -0.18547 | -0.18547 | -0.18547 |
| Tax Rate, % | -55.72 | -55.72 | -55.72 | -55.72 | -55.72 | -55.72 | -55.72 | -55.72 | -55.72 | -55.72 |
| EBITAT | .6 | -7.9 | 12.6 | -1.0 | -17.5 | -1.4 | -1.3 | -1.2 | -1.1 | -1.0 |
| Depreciation | ||||||||||
| Changes in Account Receivables | ||||||||||
| Changes in Inventories | ||||||||||
| Changes in Accounts Payable | ||||||||||
| Capital Expenditure | ||||||||||
| UFCF | -21.7 | -2.9 | 22.9 | 2.3 | -10.6 | -1.1 | 2.3 | 2.2 | 2.0 | 1.9 |
| WACC, % | 13.14 | 13.94 | 14.03 | 13.85 | 14.03 | 13.8 | 13.8 | 13.8 | 13.8 | 13.8 |
| PV UFCF | ||||||||||
| SUM PV UFCF | 4.5 | |||||||||
| Long Term Growth Rate, % | 2.00 | |||||||||
| Free cash flow (T + 1) | 2 | |||||||||
| Terminal Value | 16 | |||||||||
| Present Terminal Value | 9 | |||||||||
| Enterprise Value | 13 | |||||||||
| Net Debt | 38 | |||||||||
| Equity Value | -25 | |||||||||
| Diluted Shares Outstanding, MM | 0 | |||||||||
| Equity Value Per Share | -51.07 |
What You Will Get
- Comprehensive STAF Financial Data: Pre-filled with Staffing 360 Solutions' historical and projected data for detailed analysis.
- Fully Customizable Template: Easily adjust key inputs such as revenue growth, WACC, and EBITDA %.
- Instant Calculations: Watch Staffing 360 Solutions' intrinsic value update in real-time as you make changes.
- Professional Valuation Tool: Tailored for investors, analysts, and consultants aiming for precise DCF results.
- User-Friendly Interface: Intuitive layout and clear guidance suitable for all levels of expertise.
Key Features
- 🔍 Real-Life STAF Financials: Pre-filled historical and projected data for Staffing 360 Solutions, Inc.
- ✏️ Fully Customizable Inputs: Adjust all critical parameters (yellow cells) such as WACC, growth %, and tax rates.
- 📊 Professional DCF Valuation: Built-in formulas calculate Staffing 360’s intrinsic value using the Discounted Cash Flow method.
- ⚡ Instant Results: Visualize Staffing 360’s valuation instantly after making changes.
- Scenario Analysis: Test and compare outcomes for various financial assumptions side-by-side.
How It Works
- Step 1: Download the prebuilt Excel template featuring Staffing 360 Solutions, Inc. (STAF) data.
- Step 2: Navigate through the pre-filled sheets to familiarize yourself with the key performance indicators.
- Step 3: Modify forecasts and assumptions in the editable yellow cells (WACC, growth, margins).
- Step 4: Instantly see recalculated results, including Staffing 360 Solutions, Inc.'s (STAF) intrinsic value.
- Step 5: Make informed investment decisions or create reports based on the generated outputs.
Why Choose Staffing 360 Solutions, Inc. (STAF)?
- User-Friendly Interface: Perfect for both newcomers and seasoned professionals.
- Customizable Inputs: Adjust parameters easily to tailor your staffing analysis.
- Real-Time Insights: Monitor immediate changes to Staffing 360's metrics as you modify inputs.
- Preloaded Data: Comes with Staffing 360's current financial information for swift evaluations.
- Relied Upon by Experts: Utilized by staffing professionals and analysts for strategic decision-making.
Who Should Use Staffing 360 Solutions, Inc. (STAF)?
- Job Seekers: Discover new career opportunities and connect with potential employers.
- Recruiters: Utilize our platform to find qualified candidates efficiently.
- HR Professionals: Enhance your talent acquisition strategies with our staffing solutions.
- Small Business Owners: Access resources to streamline your hiring process and build a strong team.
- Industry Analysts: Analyze market trends and staffing needs within various sectors.
What the Template Contains
- Pre-Filled Data: Includes Staffing 360 Solutions, Inc.'s historical financials and forecasts.
- Discounted Cash Flow Model: Editable DCF valuation model with automatic calculations.
- Weighted Average Cost of Capital (WACC): A dedicated sheet for calculating WACC based on custom inputs.
- Key Financial Ratios: Analyze Staffing 360 Solutions, Inc.'s profitability, efficiency, and leverage.
- Customizable Inputs: Edit revenue growth, margins, and tax rates with ease.
- Clear Dashboard: Charts and tables summarizing key valuation results.
Disclaimer
All information, articles, and product details provided on this website are for general informational and educational purposes only. We do not claim any ownership over, nor do we intend to infringe upon, any trademarks, copyrights, logos, brand names, or other intellectual property mentioned or depicted on this site. Such intellectual property remains the property of its respective owners, and any references here are made solely for identification or informational purposes, without implying any affiliation, endorsement, or partnership.
We make no representations or warranties, express or implied, regarding the accuracy, completeness, or suitability of any content or products presented. Nothing on this website should be construed as legal, tax, investment, financial, medical, or other professional advice. In addition, no part of this site—including articles or product references—constitutes a solicitation, recommendation, endorsement, advertisement, or offer to buy or sell any securities, franchises, or other financial instruments, particularly in jurisdictions where such activity would be unlawful.
All content is of a general nature and may not address the specific circumstances of any individual or entity. It is not a substitute for professional advice or services. Any actions you take based on the information provided here are strictly at your own risk. You accept full responsibility for any decisions or outcomes arising from your use of this website and agree to release us from any liability in connection with your use of, or reliance upon, the content or products found herein.