
|
Avaliação Steris PLC (STE) DCF |
Totalmente Editável: Adapte-Se Às Suas Necessidades No Excel Ou Planilhas
Design Profissional: Modelos Confiáveis E Padrão Da Indústria
Pré-Construídos Para Uso Rápido E Eficiente
Compatível com MAC/PC, totalmente desbloqueado
Não É Necessária Experiência; Fácil De Seguir
STERIS plc (STE) Bundle
Aprimore suas opções de investimento com a calculadora DCF Steris PLC (STE)! Explore dados financeiros da Steris autênticos, ajuste as projeções e despesas de crescimento e observe como essas modificações afetam o valor intrínseco do Steris PLC (STE) em tempo real.
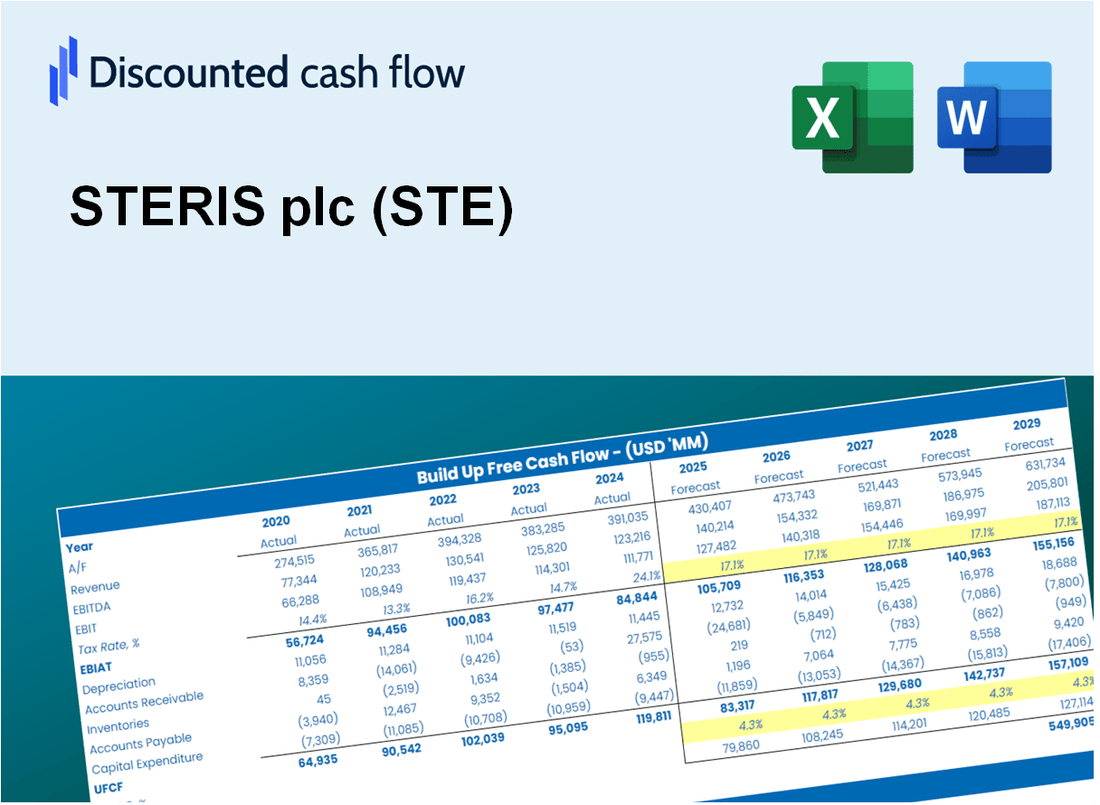
Discounted Cash Flow (DCF) - (USD MM)
| Year | AY1 2021 |
AY2 2022 |
AY3 2023 |
AY4 2024 |
AY5 2025 |
FY1 2026 |
FY2 2027 |
FY3 2028 |
FY4 2029 |
FY5 2030 |
|---|---|---|---|---|---|---|---|---|---|---|
| Revenue | 3,107.5 | 4,223.4 | 4,536.3 | 5,138.7 | 5,459.5 | 6,317.2 | 7,309.7 | 8,458.0 | 9,786.8 | 11,324.3 |
| Revenue Growth, % | 0 | 35.91 | 7.41 | 13.28 | 6.24 | 15.71 | 15.71 | 15.71 | 15.71 | 15.71 |
| EBITDA | 774.0 | 1,009.4 | 1,344.0 | 1,412.4 | 1,358.7 | 1,652.7 | 1,912.3 | 2,212.7 | 2,560.3 | 2,962.6 |
| EBITDA, % | 24.91 | 23.9 | 29.63 | 27.49 | 24.89 | 26.16 | 26.16 | 26.16 | 26.16 | 26.16 |
| Depreciation | 219.2 | 553.1 | 552.9 | 565.2 | 476.2 | 657.8 | 761.1 | 880.7 | 1,019.0 | 1,179.1 |
| Depreciation, % | 7.06 | 13.1 | 12.19 | 11 | 8.72 | 10.41 | 10.41 | 10.41 | 10.41 | 10.41 |
| EBIT | 554.7 | 456.3 | 791.1 | 847.2 | 882.5 | 994.9 | 1,151.2 | 1,332.0 | 1,541.3 | 1,783.4 |
| EBIT, % | 17.85 | 10.8 | 17.44 | 16.49 | 16.16 | 15.75 | 15.75 | 15.75 | 15.75 | 15.75 |
| Total Cash | 220.5 | 348.3 | 208.4 | 207.0 | 171.7 | 342.5 | 396.3 | 458.6 | 530.7 | 614.0 |
| Total Cash, percent | .0 | .0 | .0 | .0 | .0 | .0 | .0 | .0 | .0 | .0 |
| Account Receivables | 609.4 | 799.0 | 865.0 | 1,008.3 | 1,044.0 | 1,217.2 | 1,408.5 | 1,629.7 | 1,885.8 | 2,182.0 |
| Account Receivables, % | 19.61 | 18.92 | 19.07 | 19.62 | 19.12 | 19.27 | 19.27 | 19.27 | 19.27 | 19.27 |
| Inventories | 315.1 | 575.0 | 604.4 | 674.5 | 581.3 | 768.8 | 889.6 | 1,029.4 | 1,191.1 | 1,378.2 |
| Inventories, % | 10.14 | 13.61 | 13.32 | 13.13 | 10.65 | 12.17 | 12.17 | 12.17 | 12.17 | 12.17 |
| Accounts Payable | 157.0 | 225.7 | 264.2 | 251.7 | 280.8 | 331.8 | 383.9 | 444.2 | 514.0 | 594.8 |
| Accounts Payable, % | 5.05 | 5.34 | 5.82 | 4.9 | 5.14 | 5.25 | 5.25 | 5.25 | 5.25 | 5.25 |
| Capital Expenditure | -239.3 | -287.6 | -362.0 | -360.3 | -370.1 | -458.4 | -530.4 | -613.7 | -710.1 | -821.7 |
| Capital Expenditure, % | -7.7 | -6.81 | -7.98 | -7.01 | -6.78 | -7.26 | -7.26 | -7.26 | -7.26 | -7.26 |
| Tax Rate, % | 22.8 | 22.8 | 22.8 | 22.8 | 22.8 | 22.8 | 22.8 | 22.8 | 22.8 | 22.8 |
| EBITAT | 425.9 | 303.4 | 124.5 | 455.9 | 681.2 | 577.1 | 667.7 | 772.6 | 894.0 | 1,034.5 |
| Depreciation | ||||||||||
| Changes in Account Receivables | ||||||||||
| Changes in Inventories | ||||||||||
| Changes in Accounts Payable | ||||||||||
| Capital Expenditure | ||||||||||
| UFCF | -361.6 | 188.2 | 258.5 | 434.9 | 874.0 | 466.7 | 638.6 | 738.9 | 855.0 | 989.3 |
| WACC, % | 7.9 | 7.87 | 7.7 | 7.83 | 7.91 | 7.84 | 7.84 | 7.84 | 7.84 | 7.84 |
| PV UFCF | ||||||||||
| SUM PV UFCF | 2,881.5 | |||||||||
| Long Term Growth Rate, % | 4.00 | |||||||||
| Free cash flow (T + 1) | 1,029 | |||||||||
| Terminal Value | 26,783 | |||||||||
| Present Terminal Value | 18,362 | |||||||||
| Enterprise Value | 21,244 | |||||||||
| Net Debt | 2,031 | |||||||||
| Equity Value | 19,213 | |||||||||
| Diluted Shares Outstanding, MM | 99 | |||||||||
| Equity Value Per Share | 193.93 |
What You Will Receive
- Pre-Filled Financial Model: STERIS plc's actual data allows for accurate DCF valuation.
- Comprehensive Forecast Control: Modify revenue growth rates, profit margins, WACC, and other critical factors.
- Real-Time Calculations: Automatic updates provide immediate feedback as you adjust parameters.
- Professional-Grade Template: A polished Excel file crafted for high-quality valuation presentations.
- Customizable and Reusable: Designed for adaptability, facilitating repeated use for in-depth forecasts.
Key Features
- Comprehensive STERIS Financials: Gain access to precise pre-loaded historical data and future forecasts.
- Adjustable Forecast Parameters: Modify highlighted cells for WACC, growth rates, and profit margins.
- Real-Time Calculations: Automatic updates for DCF, Net Present Value (NPV), and cash flow assessments.
- User-Friendly Dashboard: Clear charts and summaries to help visualize your valuation findings.
- Suitable for All Skill Levels: An intuitive design tailored for investors, CFOs, and consultants alike.
How It Works
- Step 1: Download the Excel file for STERIS plc (STE).
- Step 2: Review STERIS plc's pre-filled financial data and forecasts.
- Step 3: Modify key inputs such as revenue growth, WACC, and tax rates (highlighted cells).
- Step 4: Observe the DCF model update in real-time as you adjust assumptions.
- Step 5: Analyze the outputs and leverage the results for investment decisions.
Why Choose This Calculator for STERIS plc (STE)?
- Comprehensive Tool: Incorporates DCF, WACC, and financial ratio analyses all in one convenient package.
- Customizable Inputs: Modify the highlighted cells to explore different financial scenarios.
- Detailed Insights: Automatically computes STERIS plc’s intrinsic value and Net Present Value.
- Preloaded Data: Access historical and projected data for accurate analysis.
- Professional Quality: Perfect for financial analysts, investors, and business consultants focused on STERIS plc (STE).
Who Should Use This Product?
- Individual Investors: Make informed decisions about buying or selling STERIS plc (STE) stock.
- Financial Analysts: Streamline valuation processes with ready-to-use financial models for STERIS plc (STE).
- Consultants: Deliver professional valuation insights on STERIS plc (STE) to clients quickly and accurately.
- Business Owners: Understand how large companies like STERIS plc (STE) are valued to guide your own strategy.
- Finance Students: Learn valuation techniques using real-world data and scenarios related to STERIS plc (STE).
What the Template Contains
- Preloaded STE Data: Historical and projected financial data, including revenue, EBIT, and capital expenditures.
- DCF and WACC Models: Professional-grade sheets for calculating intrinsic value and Weighted Average Cost of Capital.
- Editable Inputs: Yellow-highlighted cells for adjusting revenue growth, tax rates, and discount rates.
- Financial Statements: Comprehensive annual and quarterly financials for deeper analysis.
- Key Ratios: Profitability, leverage, and efficiency ratios to evaluate performance.
- Dashboard and Charts: Visual summaries of valuation outcomes and assumptions.
Disclaimer
All information, articles, and product details provided on this website are for general informational and educational purposes only. We do not claim any ownership over, nor do we intend to infringe upon, any trademarks, copyrights, logos, brand names, or other intellectual property mentioned or depicted on this site. Such intellectual property remains the property of its respective owners, and any references here are made solely for identification or informational purposes, without implying any affiliation, endorsement, or partnership.
We make no representations or warranties, express or implied, regarding the accuracy, completeness, or suitability of any content or products presented. Nothing on this website should be construed as legal, tax, investment, financial, medical, or other professional advice. In addition, no part of this site—including articles or product references—constitutes a solicitation, recommendation, endorsement, advertisement, or offer to buy or sell any securities, franchises, or other financial instruments, particularly in jurisdictions where such activity would be unlawful.
All content is of a general nature and may not address the specific circumstances of any individual or entity. It is not a substitute for professional advice or services. Any actions you take based on the information provided here are strictly at your own risk. You accept full responsibility for any decisions or outcomes arising from your use of this website and agree to release us from any liability in connection with your use of, or reliance upon, the content or products found herein.