
|
Stef SA (Stf.pa) DCF Avaliação |
Totalmente Editável: Adapte-Se Às Suas Necessidades No Excel Ou Planilhas
Design Profissional: Modelos Confiáveis E Padrão Da Indústria
Pré-Construídos Para Uso Rápido E Eficiente
Compatível com MAC/PC, totalmente desbloqueado
Não É Necessária Experiência; Fácil De Seguir
STEF SA (STF.PA) Bundle
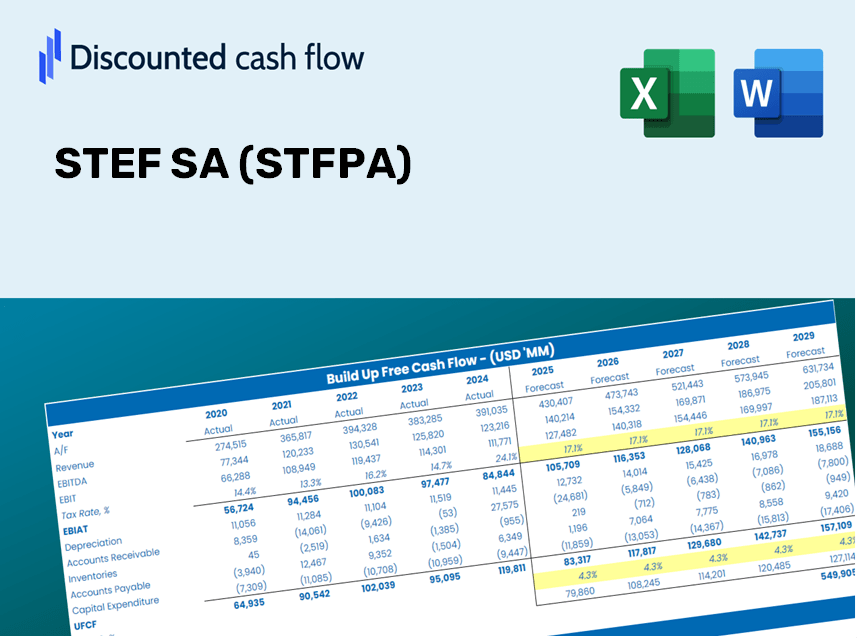
Projetado para precisão, nossa calculadora DCF (STFPA) permite avaliar a avaliação do Stef SA usando dados financeiros do mundo real, oferecendo flexibilidade completa para modificar todos os parâmetros essenciais para melhorar as projeções.
Discounted Cash Flow (DCF) - (USD MM)
| Year | AY1 2020 |
AY2 2021 |
AY3 2022 |
AY4 2023 |
AY5 2024 |
FY1 2025 |
FY2 2026 |
FY3 2027 |
FY4 2028 |
FY5 2029 |
|---|---|---|---|---|---|---|---|---|---|---|
| Revenue | 3,145.0 | 3,506.6 | 4,159.7 | 4,442.1 | 4,800.8 | 5,340.7 | 5,941.3 | 6,609.5 | 7,352.8 | 8,179.7 |
| Revenue Growth, % | 0 | 11.5 | 18.62 | 6.79 | 8.07 | 11.25 | 11.25 | 11.25 | 11.25 | 11.25 |
| EBITDA | 292.2 | 333.4 | 417.7 | 455.6 | 471.2 | 522.4 | 581.2 | 646.6 | 719.3 | 800.2 |
| EBITDA, % | 9.29 | 9.51 | 10.04 | 10.26 | 9.82 | 9.78 | 9.78 | 9.78 | 9.78 | 9.78 |
| Depreciation | 174.3 | 178.5 | 183.2 | 200.1 | 241.3 | 262.4 | 291.9 | 324.8 | 361.3 | 401.9 |
| Depreciation, % | 5.54 | 5.09 | 4.4 | 4.5 | 5.03 | 4.91 | 4.91 | 4.91 | 4.91 | 4.91 |
| EBIT | 117.9 | 154.9 | 234.4 | 255.5 | 229.9 | 260.0 | 289.3 | 321.8 | 358.0 | 398.2 |
| EBIT, % | 3.75 | 4.42 | 5.64 | 5.75 | 4.79 | 4.87 | 4.87 | 4.87 | 4.87 | 4.87 |
| Total Cash | 54.4 | 92.2 | 87.6 | 143.6 | 85.1 | 122.5 | 136.3 | 151.6 | 168.7 | 187.7 |
| Total Cash, percent | .0 | .0 | .0 | .0 | .0 | .0 | .0 | .0 | .0 | .0 |
| Account Receivables | 552.0 | 643.3 | 771.8 | 748.2 | 823.4 | 944.7 | 1,050.9 | 1,169.1 | 1,300.6 | 1,446.9 |
| Account Receivables, % | 17.55 | 18.34 | 18.56 | 16.84 | 17.15 | 17.69 | 17.69 | 17.69 | 17.69 | 17.69 |
| Inventories | 81.2 | 86.2 | 126.3 | 125.5 | 101.6 | 139.1 | 154.7 | 172.1 | 191.5 | 213.0 |
| Inventories, % | 2.58 | 2.46 | 3.04 | 2.83 | 2.12 | 2.6 | 2.6 | 2.6 | 2.6 | 2.6 |
| Accounts Payable | 461.0 | 557.6 | 636.2 | 616.2 | 628.4 | 777.8 | 865.2 | 962.5 | 1,070.8 | 1,191.2 |
| Accounts Payable, % | 14.66 | 15.9 | 15.3 | 13.87 | 13.09 | 14.56 | 14.56 | 14.56 | 14.56 | 14.56 |
| Capital Expenditure | -208.1 | -165.1 | -229.5 | -335.8 | -355.3 | -339.7 | -377.9 | -420.4 | -467.7 | -520.3 |
| Capital Expenditure, % | -6.62 | -4.71 | -5.52 | -7.56 | -7.4 | -6.36 | -6.36 | -6.36 | -6.36 | -6.36 |
| Tax Rate, % | 16.61 | 16.61 | 16.61 | 16.61 | 16.61 | 16.61 | 16.61 | 16.61 | 16.61 | 16.61 |
| EBITAT | 78.5 | 115.5 | 145.5 | 206.1 | 191.7 | 191.0 | 212.5 | 236.4 | 262.9 | 292.5 |
| Depreciation | ||||||||||
| Changes in Account Receivables | ||||||||||
| Changes in Inventories | ||||||||||
| Changes in Accounts Payable | ||||||||||
| Capital Expenditure | ||||||||||
| UFCF | -127.5 | 129.1 | 9.2 | 74.9 | 38.7 | 104.3 | 92.1 | 102.4 | 114.0 | 126.8 |
| WACC, % | 5.19 | 5.33 | 5.12 | 5.44 | 5.48 | 5.31 | 5.31 | 5.31 | 5.31 | 5.31 |
| PV UFCF | ||||||||||
| SUM PV UFCF | 460.3 | |||||||||
| Long Term Growth Rate, % | 2.00 | |||||||||
| Free cash flow (T + 1) | 129 | |||||||||
| Terminal Value | 3,904 | |||||||||
| Present Terminal Value | 3,014 | |||||||||
| Enterprise Value | 3,474 | |||||||||
| Net Debt | 1,340 | |||||||||
| Equity Value | 2,134 | |||||||||
| Diluted Shares Outstanding, MM | 13 | |||||||||
| Equity Value Per Share | 169.16 |
What You Will Receive
- Pre-Populated Financial Model: STAF SA’s actual data allows for accurate DCF valuation.
- Comprehensive Forecast Control: Modify revenue growth, profit margins, WACC, and other essential variables.
- Real-Time Calculations: Automatic updates guarantee you see outcomes as you adjust inputs.
- Professional-Grade Template: A polished Excel file crafted for serious valuation work.
- Flexible and Reusable: Designed for adaptability, making it perfect for ongoing detailed forecasts.
Key Features
- Pre-Loaded Data: Historical financial statements and pre-filled forecasts for STEF SA (STFPA).
- Fully Adjustable Inputs: Modify WACC, tax rates, revenue growth, and EBITDA margins as needed.
- Instant Results: View the intrinsic value of STEF SA (STFPA) recalculated in real time.
- Clear Visual Outputs: Dashboard charts illustrate valuation results and key performance metrics.
- Built for Accuracy: A professional-grade tool designed for analysts, investors, and finance professionals.
How It Functions
- Download: Obtain the fully equipped Excel file containing STEF SA’s (STFPA) financial data.
- Customize: Modify projections such as revenue growth, EBITDA percentage, and WACC.
- Update Instantly: The intrinsic value and NPV calculations refresh in real time.
- Evaluate Scenarios: Generate various forecasts and instantly compare the results.
- Make Informed Choices: Leverage the valuation insights to inform your investment decisions.
Why Select the STEF SA (STFPA) Calculator?
- Time-Efficient: Start analyzing immediately with a pre-built DCF model.
- Enhanced Accuracy: Dependable financial data and methodologies minimize valuation errors.
- Completely Customizable: Adjust the model to align with your specific assumptions and forecasts.
- Intuitive Analysis: User-friendly charts and outputs facilitate straightforward result interpretation.
- Endorsed by Professionals: Crafted for experts who prioritize both precision and functionality.
Who Should Consider Using This Product?
- Investors: Assess the valuation of STEF SA (STFPA) before making investment decisions.
- CFOs and Financial Analysts: Optimize valuation workflows and evaluate financial forecasts.
- Startup Founders: Understand the valuation methods applied to established companies like STEF SA (STFPA).
- Consultants: Produce insightful valuation reports for your clients regarding STEF SA (STFPA).
- Students and Educators: Utilize actual market data to learn and teach valuation strategies related to STEF SA (STFPA).
Contents of the Template
- Extensive DCF Model: Editable template featuring thorough valuation computations.
- Real-World Data: Historical and projected financials for STEF SA (STFPA) preloaded for in-depth analysis.
- Adjustable Parameters: Modify WACC, growth rates, and tax assumptions to explore various scenarios.
- Financial Statements: Complete annual and quarterly breakdowns for enhanced insights.
- Key Ratios: Integrated analysis focusing on profitability, efficiency, and leverage metrics.
- Dashboard with Visual Outputs: Visual charts and tables providing clear, actionable results.
Disclaimer
All information, articles, and product details provided on this website are for general informational and educational purposes only. We do not claim any ownership over, nor do we intend to infringe upon, any trademarks, copyrights, logos, brand names, or other intellectual property mentioned or depicted on this site. Such intellectual property remains the property of its respective owners, and any references here are made solely for identification or informational purposes, without implying any affiliation, endorsement, or partnership.
We make no representations or warranties, express or implied, regarding the accuracy, completeness, or suitability of any content or products presented. Nothing on this website should be construed as legal, tax, investment, financial, medical, or other professional advice. In addition, no part of this site—including articles or product references—constitutes a solicitation, recommendation, endorsement, advertisement, or offer to buy or sell any securities, franchises, or other financial instruments, particularly in jurisdictions where such activity would be unlawful.
All content is of a general nature and may not address the specific circumstances of any individual or entity. It is not a substitute for professional advice or services. Any actions you take based on the information provided here are strictly at your own risk. You accept full responsibility for any decisions or outcomes arising from your use of this website and agree to release us from any liability in connection with your use of, or reliance upon, the content or products found herein.