
|
St. James's Place plc (Stj.l) Avaliação DCF |
Totalmente Editável: Adapte-Se Às Suas Necessidades No Excel Ou Planilhas
Design Profissional: Modelos Confiáveis E Padrão Da Indústria
Pré-Construídos Para Uso Rápido E Eficiente
Compatível com MAC/PC, totalmente desbloqueado
Não É Necessária Experiência; Fácil De Seguir
St. James's Place plc (STJ.L) Bundle
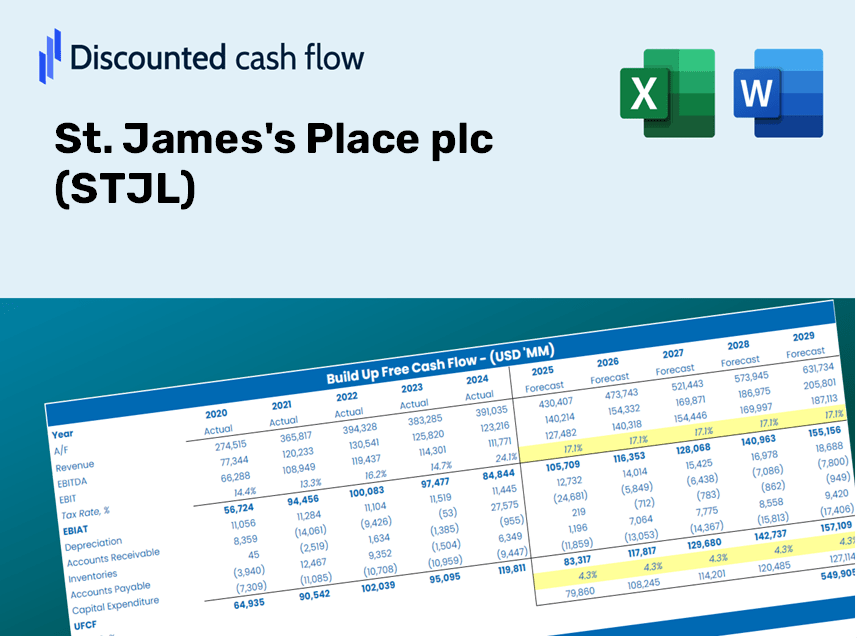
Obtenha informações sobre a análise de avaliação do St. James's Place Plc (STJL) usando nossa calculadora DCF de última geração! Projetado com dados reais (STJL), este modelo do Excel permite ajustar as previsões e suposições, permitindo que você determine com precisão o valor intrínseco do St. James's Place Plc.
Discounted Cash Flow (DCF) - (USD MM)
| Year | AY1 2020 |
AY2 2021 |
AY3 2022 |
AY4 2023 |
AY5 2024 |
FY1 2025 |
FY2 2026 |
FY3 2027 |
FY4 2028 |
FY5 2029 |
|---|---|---|---|---|---|---|---|---|---|---|
| Revenue | 8,080.6 | 17,756.5 | -7,479.8 | 18,885.9 | 25,855.6 | 21,777.2 | 18,342.0 | 15,448.8 | 13,011.9 | 10,959.4 |
| Revenue Growth, % | 0 | 119.74 | -142.12 | -352.49 | 36.9 | -15.77 | -15.77 | -15.77 | -15.77 | -15.77 |
| EBITDA | 457.9 | 890.1 | 49.4 | 496.3 | .0 | 550.8 | 463.9 | 390.8 | 329.1 | 277.2 |
| EBITDA, % | 5.67 | 5.01 | -0.66045 | 2.63 | 0 | 2.53 | 2.53 | 2.53 | 2.53 | 2.53 |
| Depreciation | 31.5 | 35.9 | 34.2 | 39.4 | 49.0 | 23.2 | 19.5 | 16.5 | 13.9 | 11.7 |
| Depreciation, % | 0.38982 | 0.20218 | -0.45723 | 0.20862 | 0.18951 | 0.10658 | 0.10658 | 0.10658 | 0.10658 | 0.10658 |
| EBIT | 426.4 | 854.2 | 15.2 | 456.9 | -49.0 | 527.6 | 444.4 | 374.3 | 315.3 | 265.5 |
| EBIT, % | 5.28 | 4.81 | -0.20321 | 2.42 | -0.18951 | 2.42 | 2.42 | 2.42 | 2.42 | 2.42 |
| Total Cash | 6,718.6 | 7,832.9 | 6,432.8 | 285.4 | 5,663.9 | 2,816.8 | 2,372.4 | 1,998.2 | 1,683.0 | 1,417.5 |
| Total Cash, percent | .0 | .0 | .0 | .0 | .0 | .0 | .0 | .0 | .0 | .0 |
| Account Receivables | .0 | .0 | .0 | .0 | 1,577.6 | 265.8 | 223.8 | 188.5 | 158.8 | 133.7 |
| Account Receivables, % | 0 | 0 | 0 | 0 | 6.1 | 1.22 | 1.22 | 1.22 | 1.22 | 1.22 |
| Inventories | .0 | .0 | .0 | .0 | -8,333.6 | -1,403.8 | -1,182.4 | -995.9 | -838.8 | -706.5 |
| Inventories, % | 0 | 0 | 0 | 0 | -32.23 | -6.45 | -6.45 | -6.45 | -6.45 | -6.45 |
| Accounts Payable | 233.6 | 448.9 | 399.9 | 521.1 | .0 | 123.3 | 103.9 | 87.5 | 73.7 | 62.1 |
| Accounts Payable, % | 2.89 | 2.53 | -5.35 | 2.76 | 0 | 0.56635 | 0.56635 | 0.56635 | 0.56635 | 0.56635 |
| Capital Expenditure | -26.8 | -22.6 | -20.1 | -22.1 | -8.7 | -26.6 | -22.4 | -18.8 | -15.9 | -13.4 |
| Capital Expenditure, % | -0.33166 | -0.12728 | 0.26872 | -0.11702 | -0.03364842 | -0.12192 | -0.12192 | -0.12192 | -0.12192 | -0.12192 |
| Tax Rate, % | 62.02 | 62.02 | 62.02 | 62.02 | 62.02 | 62.02 | 62.02 | 62.02 | 62.02 | 62.02 |
| EBITAT | 262.0 | 290.7 | 8,833.4 | -10.5 | -18.6 | 246.3 | 207.5 | 174.8 | 147.2 | 124.0 |
| Depreciation | ||||||||||
| Changes in Account Receivables | ||||||||||
| Changes in Inventories | ||||||||||
| Changes in Accounts Payable | ||||||||||
| Capital Expenditure | ||||||||||
| UFCF | 500.3 | 519.3 | 8,798.5 | 128.0 | 6,256.6 | -5,251.6 | 5.7 | 4.8 | 4.0 | 3.4 |
| WACC, % | 8.35 | 8.27 | 8.47 | 8.17 | 8.28 | 8.31 | 8.31 | 8.31 | 8.31 | 8.31 |
| PV UFCF | ||||||||||
| SUM PV UFCF | -4,834.8 | |||||||||
| Long Term Growth Rate, % | 2.00 | |||||||||
| Free cash flow (T + 1) | 3 | |||||||||
| Terminal Value | 55 | |||||||||
| Present Terminal Value | 37 | |||||||||
| Enterprise Value | -4,798 | |||||||||
| Net Debt | -5,040 | |||||||||
| Equity Value | 242 | |||||||||
| Diluted Shares Outstanding, MM | 549 | |||||||||
| Equity Value Per Share | 44.09 |
Benefits You Will Receive
- Customizable Scenario Inputs: Effortlessly modify assumptions (growth %, margins, WACC) to explore various outcomes.
- Pre-Populated Financial Data: St. James's Place plc’s (STJL) financial figures are included to expedite your analysis.
- Automatic DCF Calculations: The template generates Net Present Value (NPV) and intrinsic value automatically.
- Professional and Adaptable Design: A sleek Excel model tailored to meet your valuation requirements.
- Designed for Analysts and Investors: Perfect for evaluating projections, confirming strategies, and enhancing efficiency.
Key Features
- Comprehensive Financial Data: Gain access to precise historical financial records and future forecasts for St. James's Place plc (STJL).
- Adjustable Forecast Parameters: Modify the highlighted cells for key metrics such as WACC, growth rates, and profit margins.
- Real-Time Calculations: Enjoy automatic updates for DCF, Net Present Value (NPV), and cash flow evaluations.
- User-Friendly Dashboard: Intuitive charts and summaries to help you visualize your valuation findings.
- Suitable for All Skill Levels: Designed with an uncomplicated layout for investors, CFOs, and consultants alike.
How It Works
- Step 1: Download the Excel file.
- Step 2: Examine the pre-populated St. James's Place plc (STJL) data (historical and forecasted).
- Step 3: Modify key assumptions (highlighted in yellow) according to your analysis.
- Step 4: Observe the automatic recalculations for St. James's Place plc (STJL)’s intrinsic value.
- Step 5: Utilize the results for your investment strategies or reporting needs.
Why Opt for This Calculator?
- Precise Information: Genuine St. James's Place plc (STJL) financials guarantee trustworthy valuation outcomes.
- Flexible Settings: Tailor essential factors like growth rates, WACC, and tax rates to align with your forecasts.
- Efficiency Boost: Ready-to-use calculations save you the hassle of starting from the ground up.
- Expert-Level Tool: Crafted for investors, analysts, and consultants alike.
- Easy to Use: User-friendly design and straightforward instructions cater to all experience levels.
Who Can Benefit from This Product?
- Finance Students: Master valuation methods and apply them using real-world data.
- Researchers: Integrate professional models into your studies or academic work.
- Investors: Validate your own assumptions and assess valuation results for St. James's Place plc (STJL) stock.
- Financial Analysts: Enhance your efficiency with a ready-to-use, customizable DCF model.
- Entrepreneurs: Discover how major public firms like St. James's Place plc (STJL) are evaluated.
Overview of the Template
- Pre-Populated Data: Contains St. James's Place plc's historical financials and future projections.
- Discounted Cash Flow Model: An editable DCF valuation framework featuring automatic calculations.
- Weighted Average Cost of Capital (WACC): A specific sheet to compute WACC based on your customized inputs.
- Essential Financial Ratios: Assess St. James's Place plc's profitability, efficiency, and debt management.
- Adjustable Inputs: Easily modify revenue growth rates, profit margins, and tax rates.
- User-Friendly Dashboard: Visual graphs and tables showcasing key valuation outputs.
Disclaimer
All information, articles, and product details provided on this website are for general informational and educational purposes only. We do not claim any ownership over, nor do we intend to infringe upon, any trademarks, copyrights, logos, brand names, or other intellectual property mentioned or depicted on this site. Such intellectual property remains the property of its respective owners, and any references here are made solely for identification or informational purposes, without implying any affiliation, endorsement, or partnership.
We make no representations or warranties, express or implied, regarding the accuracy, completeness, or suitability of any content or products presented. Nothing on this website should be construed as legal, tax, investment, financial, medical, or other professional advice. In addition, no part of this site—including articles or product references—constitutes a solicitation, recommendation, endorsement, advertisement, or offer to buy or sell any securities, franchises, or other financial instruments, particularly in jurisdictions where such activity would be unlawful.
All content is of a general nature and may not address the specific circumstances of any individual or entity. It is not a substitute for professional advice or services. Any actions you take based on the information provided here are strictly at your own risk. You accept full responsibility for any decisions or outcomes arising from your use of this website and agree to release us from any liability in connection with your use of, or reliance upon, the content or products found herein.