
|
Avaliação DCF Stantec Inc. (STN) |
Totalmente Editável: Adapte-Se Às Suas Necessidades No Excel Ou Planilhas
Design Profissional: Modelos Confiáveis E Padrão Da Indústria
Pré-Construídos Para Uso Rápido E Eficiente
Compatível com MAC/PC, totalmente desbloqueado
Não É Necessária Experiência; Fácil De Seguir
Stantec Inc. (STN) Bundle
Descubra o verdadeiro potencial da Stantec Inc. (STN) com nossa calculadora DCF avançada! Ajuste as principais suposições, explore vários cenários e avalie como as mudanças influenciam a avaliação STantec Inc. (STN) - tudo em um modelo conveniente do Excel.
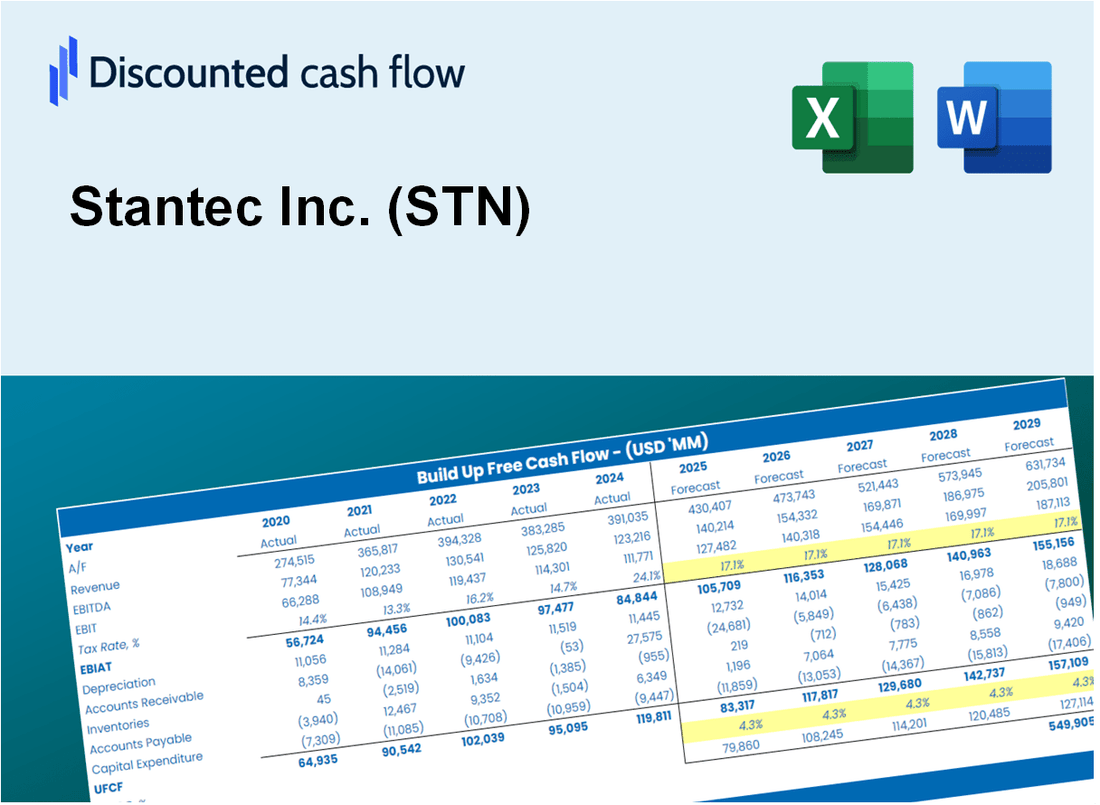
Discounted Cash Flow (DCF) - (USD MM)
| Year | AY1 2020 |
AY2 2021 |
AY3 2022 |
AY4 2023 |
AY5 2024 |
FY1 2025 |
FY2 2026 |
FY3 2027 |
FY4 2028 |
FY5 2029 |
|---|---|---|---|---|---|---|---|---|---|---|
| Revenue | 3,372.8 | 3,263.5 | 4,048.1 | 3,612.4 | 4,183.1 | 4,453.4 | 4,741.0 | 5,047.3 | 5,373.3 | 5,720.4 |
| Revenue Growth, % | 0 | -3.24 | 24.04 | -10.76 | 15.8 | 6.46 | 6.46 | 6.46 | 6.46 | 6.46 |
| EBITDA | 355.5 | 373.2 | 483.1 | 580.1 | 643.0 | 581.9 | 619.5 | 659.6 | 702.2 | 747.5 |
| EBITDA, % | 10.54 | 11.44 | 11.93 | 16.06 | 15.37 | 13.07 | 13.07 | 13.07 | 13.07 | 13.07 |
| Depreciation | 163.1 | 158.2 | 202.1 | 202.2 | 227.2 | 229.0 | 243.7 | 259.5 | 276.2 | 294.1 |
| Depreciation, % | 4.84 | 4.85 | 4.99 | 5.6 | 5.43 | 5.14 | 5.14 | 5.14 | 5.14 | 5.14 |
| EBIT | 192.4 | 215.1 | 280.9 | 377.8 | 415.8 | 353.0 | 375.8 | 400.1 | 425.9 | 453.4 |
| EBIT, % | 5.7 | 6.59 | 6.94 | 10.46 | 9.94 | 7.93 | 7.93 | 7.93 | 7.93 | 7.93 |
| Total Cash | 203.2 | 138.3 | 105.7 | 251.6 | 181.6 | 215.4 | 229.3 | 244.1 | 259.9 | 276.7 |
| Total Cash, percent | .0 | .0 | .0 | .0 | .0 | .0 | .0 | .0 | .0 | .0 |
| Account Receivables | 851.4 | 999.1 | 1,234.1 | 1,318.2 | 1,589.2 | 1,432.4 | 1,525.0 | 1,623.5 | 1,728.3 | 1,840.0 |
| Account Receivables, % | 25.24 | 30.62 | 30.49 | 36.49 | 37.99 | 32.17 | 32.17 | 32.17 | 32.17 | 32.17 |
| Inventories | 31.3 | 32.7 | 34.7 | .0 | .0 | 24.8 | 26.4 | 28.1 | 29.9 | 31.9 |
| Inventories, % | 0.9281 | 1 | 0.85606 | 0 | 0 | 0.55697 | 0.55697 | 0.55697 | 0.55697 | 0.55697 |
| Accounts Payable | 155.2 | 151.9 | 214.3 | 250.9 | 319.2 | 259.4 | 276.2 | 294.0 | 313.0 | 333.2 |
| Accounts Payable, % | 4.6 | 4.66 | 5.29 | 6.95 | 7.63 | 5.83 | 5.83 | 5.83 | 5.83 | 5.83 |
| Capital Expenditure | -24.4 | -36.1 | -53.4 | -71.7 | -70.6 | -60.8 | -64.7 | -68.9 | -73.3 | -78.0 |
| Capital Expenditure, % | -0.72303 | -1.11 | -1.32 | -1.99 | -1.69 | -1.36 | -1.36 | -1.36 | -1.36 | -1.36 |
| Tax Rate, % | 22.31 | 22.31 | 22.31 | 22.31 | 22.31 | 22.31 | 22.31 | 22.31 | 22.31 | 22.31 |
| EBITAT | 153.0 | 164.1 | 213.4 | 292.9 | 323.0 | 273.2 | 290.9 | 309.7 | 329.7 | 351.0 |
| Depreciation | ||||||||||
| Changes in Account Receivables | ||||||||||
| Changes in Inventories | ||||||||||
| Changes in Accounts Payable | ||||||||||
| Capital Expenditure | ||||||||||
| UFCF | -435.9 | 133.9 | 187.6 | 410.5 | 276.9 | 513.6 | 392.6 | 417.9 | 444.9 | 473.7 |
| WACC, % | 7.71 | 7.69 | 7.68 | 7.69 | 7.69 | 7.69 | 7.69 | 7.69 | 7.69 | 7.69 |
| PV UFCF | ||||||||||
| SUM PV UFCF | 1,807.8 | |||||||||
| Long Term Growth Rate, % | 2.00 | |||||||||
| Free cash flow (T + 1) | 483 | |||||||||
| Terminal Value | 8,486 | |||||||||
| Present Terminal Value | 5,859 | |||||||||
| Enterprise Value | 7,666 | |||||||||
| Net Debt | 1,294 | |||||||||
| Equity Value | 6,373 | |||||||||
| Diluted Shares Outstanding, MM | 114 | |||||||||
| Equity Value Per Share | 55.87 |
What You Will Get
- Editable Forecast Inputs: Easily modify assumptions (growth %, margins, WACC) to explore various scenarios.
- Real-World Data: Stantec Inc.’s (STN) financial data pre-filled to kickstart your analysis.
- Automatic DCF Outputs: The template computes Net Present Value (NPV) and intrinsic value automatically.
- Customizable and Professional: A sleek Excel model that adjusts to your valuation requirements.
- Built for Analysts and Investors: Perfect for evaluating projections, confirming strategies, and enhancing efficiency.
Key Features
- Customizable Financial Metrics: Adjust essential inputs such as project revenue, profit margins, and operational costs.
- Instant DCF Valuation: Automatically computes intrinsic value, net present value (NPV), and additional financial metrics.
- High-Precision Accuracy: Leverages Stantec Inc.'s (STN) actual financial data for credible valuation results.
- Effortless Scenario Testing: Easily evaluate various assumptions and analyze their impacts on outcomes.
- Efficiency Booster: Remove the necessity of constructing intricate valuation models from the ground up.
How It Works
- Download: Get the pre-prepared Excel file featuring Stantec Inc.'s (STN) financial data.
- Customize: Modify projections such as revenue growth, EBITDA %, and WACC.
- Update Automatically: The intrinsic value and NPV calculations refresh in real-time.
- Test Scenarios: Develop various projections and instantly compare the results.
- Make Decisions: Utilize the valuation findings to inform your investment strategy.
Why Choose Stantec Inc. (STN) Calculator?
- Accuracy: Utilizes real Stantec financial data for precise calculations.
- Flexibility: Allows users to easily adjust and test different inputs.
- Time-Saving: Avoid the complexities of creating a financial model from the ground up.
- Professional-Grade: Crafted with the expertise and attention to detail expected at the CFO level.
- User-Friendly: Intuitive design makes it accessible for users without extensive financial modeling skills.
Who Should Use This Product?
- Investors: Assess Stantec Inc.'s (STN) valuation prior to making investment decisions.
- CFOs and Financial Analysts: Optimize valuation methodologies and evaluate financial forecasts.
- Startup Founders: Understand the valuation approaches of established firms like Stantec Inc. (STN).
- Consultants: Provide detailed valuation analyses and reports for clients.
- Students and Educators: Utilize current data to learn and teach valuation strategies effectively.
What the Template Contains
- Pre-Filled DCF Model: Stantec Inc.’s (STN) financial data preloaded for immediate use.
- WACC Calculator: Detailed calculations for Weighted Average Cost of Capital.
- Financial Ratios: Evaluate Stantec Inc.’s (STN) profitability, leverage, and efficiency.
- Editable Inputs: Change assumptions such as growth, margins, and CAPEX to fit your scenarios.
- Financial Statements: Annual and quarterly reports to support detailed analysis.
- Interactive Dashboard: Easily visualize key valuation metrics and results.
Disclaimer
All information, articles, and product details provided on this website are for general informational and educational purposes only. We do not claim any ownership over, nor do we intend to infringe upon, any trademarks, copyrights, logos, brand names, or other intellectual property mentioned or depicted on this site. Such intellectual property remains the property of its respective owners, and any references here are made solely for identification or informational purposes, without implying any affiliation, endorsement, or partnership.
We make no representations or warranties, express or implied, regarding the accuracy, completeness, or suitability of any content or products presented. Nothing on this website should be construed as legal, tax, investment, financial, medical, or other professional advice. In addition, no part of this site—including articles or product references—constitutes a solicitation, recommendation, endorsement, advertisement, or offer to buy or sell any securities, franchises, or other financial instruments, particularly in jurisdictions where such activity would be unlawful.
All content is of a general nature and may not address the specific circumstances of any individual or entity. It is not a substitute for professional advice or services. Any actions you take based on the information provided here are strictly at your own risk. You accept full responsibility for any decisions or outcomes arising from your use of this website and agree to release us from any liability in connection with your use of, or reliance upon, the content or products found herein.