
|
Sundaram Finance Limited (SUNDARMFIN.NS) Avaliação DCF |
Totalmente Editável: Adapte-Se Às Suas Necessidades No Excel Ou Planilhas
Design Profissional: Modelos Confiáveis E Padrão Da Indústria
Pré-Construídos Para Uso Rápido E Eficiente
Compatível com MAC/PC, totalmente desbloqueado
Não É Necessária Experiência; Fácil De Seguir
Sundaram Finance Limited (SUNDARMFIN.NS) Bundle
Avalie as perspectivas financeiras da Sundaram Finance Limited como um especialista! Essa calculadora DCF (SundarmFinns) fornece finanças pré-preenchidas, juntamente com a flexibilidade para modificar o crescimento da receita, o WACC, as margens e outras suposições cruciais para se alinhar às suas previsões.
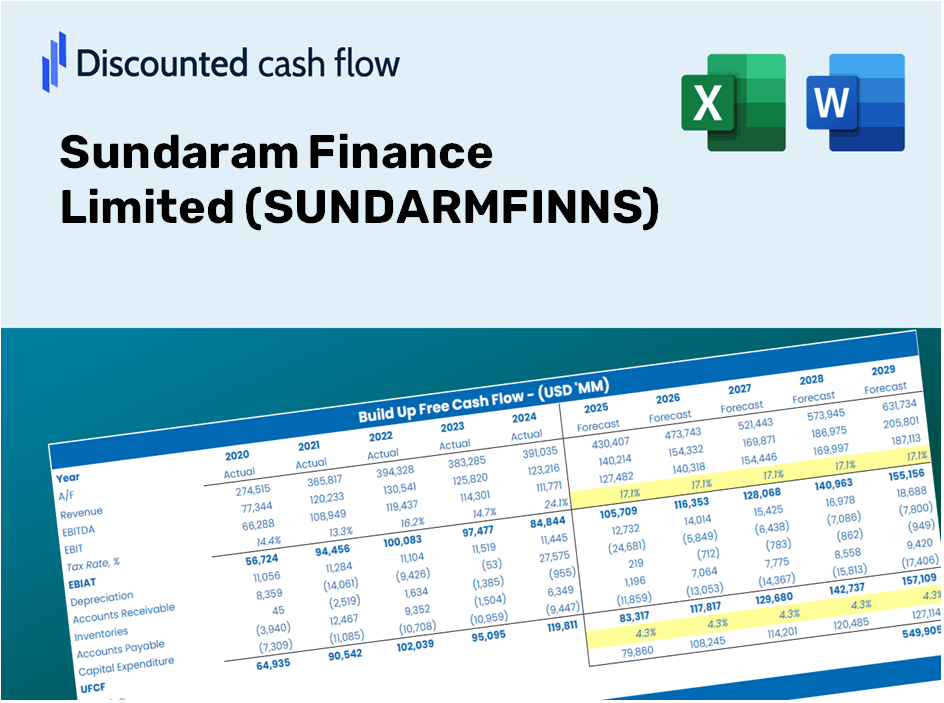
Discounted Cash Flow (DCF) - (USD MM)
| Year | AY1 2021 |
AY2 2022 |
AY3 2023 |
AY4 2024 |
AY5 2025 |
FY1 2026 |
FY2 2027 |
FY3 2028 |
FY4 2029 |
FY5 2030 |
|---|---|---|---|---|---|---|---|---|---|---|
| Revenue | 52,593.7 | 51,045.0 | 54,426.0 | 36,296.8 | 84,561.6 | 99,437.9 | 116,931.3 | 137,502.2 | 161,691.9 | 190,137.2 |
| Revenue Growth, % | 0 | -2.94 | 6.62 | -33.31 | 132.97 | 17.59 | 17.59 | 17.59 | 17.59 | 17.59 |
| EBITDA | 35,368.6 | 33,599.0 | 38,386.1 | 51,912.4 | 26,699.4 | 66,658.0 | 78,384.6 | 92,174.3 | 108,389.8 | 127,458.1 |
| EBITDA, % | 67.25 | 65.82 | 70.53 | 143.02 | 31.57 | 67.03 | 67.03 | 67.03 | 67.03 | 67.03 |
| Depreciation | 929.7 | 1,011.7 | 1,388.4 | 1,828.6 | 2,225.5 | 2,778.4 | 3,267.2 | 3,841.9 | 4,517.8 | 5,312.6 |
| Depreciation, % | 1.77 | 1.98 | 2.55 | 5.04 | 2.63 | 2.79 | 2.79 | 2.79 | 2.79 | 2.79 |
| EBIT | 34,438.9 | 32,587.3 | 36,997.7 | 50,083.8 | 24,473.9 | 64,881.5 | 76,295.7 | 89,717.8 | 105,501.2 | 124,061.3 |
| EBIT, % | 65.48 | 63.84 | 67.98 | 137.98 | 28.94 | 65.25 | 65.25 | 65.25 | 65.25 | 65.25 |
| Total Cash | 2,364.3 | 2,064.4 | 11,451.8 | 15,026.8 | 11,474.6 | 16,814.9 | 19,773.1 | 23,251.6 | 27,342.1 | 32,152.2 |
| Total Cash, percent | .0 | .0 | .0 | .0 | .0 | .0 | .0 | .0 | .0 | .0 |
| Account Receivables | 852.7 | 669.7 | 813.7 | 1,417.6 | 2,276.2 | 2,192.7 | 2,578.5 | 3,032.1 | 3,565.5 | 4,192.8 |
| Account Receivables, % | 1.62 | 1.31 | 1.5 | 3.91 | 2.69 | 2.21 | 2.21 | 2.21 | 2.21 | 2.21 |
| Inventories | .0 | 7,623.8 | 11,454.1 | .0 | .0 | 7,155.7 | 8,414.5 | 9,894.9 | 11,635.6 | 13,682.5 |
| Inventories, % | 0 | 14.94 | 21.05 | 0 | 0 | 7.2 | 7.2 | 7.2 | 7.2 | 7.2 |
| Accounts Payable | 697.9 | 1,287.1 | 1,256.5 | 1,733.0 | 2,222.0 | 2,696.6 | 3,171.0 | 3,728.9 | 4,384.9 | 5,156.3 |
| Accounts Payable, % | 1.33 | 2.52 | 2.31 | 4.77 | 2.63 | 2.71 | 2.71 | 2.71 | 2.71 | 2.71 |
| Capital Expenditure | -147.1 | -2,764.8 | -253.5 | -833.5 | -460.9 | -1,790.5 | -2,105.5 | -2,475.9 | -2,911.5 | -3,423.7 |
| Capital Expenditure, % | -0.27968 | -5.42 | -0.46577 | -2.3 | -0.54505 | -1.8 | -1.8 | -1.8 | -1.8 | -1.8 |
| Tax Rate, % | 25.24 | 25.24 | 25.24 | 25.24 | 25.24 | 25.24 | 25.24 | 25.24 | 25.24 | 25.24 |
| EBITAT | 25,877.9 | 23,226.1 | 25,337.6 | 30,205.6 | 18,296.3 | 45,412.9 | 53,402.0 | 62,796.7 | 73,844.0 | 86,834.9 |
| Depreciation | ||||||||||
| Changes in Account Receivables | ||||||||||
| Changes in Inventories | ||||||||||
| Changes in Accounts Payable | ||||||||||
| Capital Expenditure | ||||||||||
| UFCF | 26,505.7 | 14,621.4 | 22,467.6 | 42,527.4 | 19,691.3 | 39,803.1 | 53,393.5 | 62,786.6 | 73,832.2 | 86,820.9 |
| WACC, % | 5.3 | 5.15 | 5.04 | 4.71 | 5.28 | 5.1 | 5.1 | 5.1 | 5.1 | 5.1 |
| PV UFCF | ||||||||||
| SUM PV UFCF | 268,545.1 | |||||||||
| Long Term Growth Rate, % | 2.00 | |||||||||
| Free cash flow (T + 1) | 88,557 | |||||||||
| Terminal Value | 2,860,981 | |||||||||
| Present Terminal Value | 2,231,503 | |||||||||
| Enterprise Value | 2,500,048 | |||||||||
| Net Debt | 502,746 | |||||||||
| Equity Value | 1,997,303 | |||||||||
| Diluted Shares Outstanding, MM | 110 | |||||||||
| Equity Value Per Share | 18,122.37 |
What You Will Receive
- Pre-Filled Financial Model: Utilize actual data from Sundaram Finance Limited (SUNDARMFINNS) for accurate DCF valuation.
- Comprehensive Forecast Control: Modify revenue growth, profit margins, WACC, and other crucial factors.
- Real-Time Calculations: Automatic updates provide immediate feedback as you adjust inputs.
- Professional-Grade Template: A polished Excel file specifically crafted for high-quality valuation.
- Customizable and Reusable: Designed for adaptability, enabling repeated usage for in-depth forecasts.
Key Features
- Authentic Sundaram Finance Data: Access reliable pre-loaded historical figures and future forecasts for Sundaram Finance Limited (SUNDARMFINNS).
- Custom Forecast Parameters: Modify highlighted fields such as WACC, growth rates, and profit margins to suit your analyses.
- Real-Time Calculations: Automatic recalculations for DCF, Net Present Value (NPV), and cash flow assessments.
- Interactive Dashboard: User-friendly charts and summaries designed to help you visualize your valuation outcomes.
- Designed for Everyone: An intuitive layout perfect for investors, CFOs, and consultants, whether seasoned or new.
How It Works
- Download: Obtain the user-friendly Excel file featuring Sundaram Finance Limited’s (SUNDARMFINNS) financial data.
- Customize: Tailor your forecasts, including revenue growth, EBITDA %, and WACC.
- Update Automatically: Real-time updates for intrinsic value and NPV calculations.
- Test Scenarios: Generate various projections and instantly compare the results.
- Make Decisions: Leverage the valuation outcomes to inform your investment strategy.
Why Choose Sundaram Finance Limited (SUNDARMFINNS) Calculator?
- Data Integrity: Based on authentic financial figures from Sundaram Finance for reliable results.
- Customizable: Users can easily adjust inputs to suit their analytical needs.
- Efficiency: Eliminate the complexity of creating a DCF model from the ground up.
- High-Quality: Crafted with the precision and functionality expected by top financial professionals.
- Accessibility: Intuitive interface designed for users of all skill levels, including beginners in financial modeling.
Who Should Consider This Product?
- Investors: Evaluate Sundaram Finance Limited’s (SUNDARMFINNS) market value before making buy or sell decisions.
- CFOs and Financial Analysts: Optimize valuation workflows and assess financial forecasts.
- Startup Founders: Gain insights into the valuation methods used by established companies like Sundaram Finance Limited.
- Consultants: Provide comprehensive valuation reports for your clients based on Sundaram Finance Limited.
- Students and Educators: Utilize practical data for hands-on learning and instruction in valuation methodologies.
Contents of the Template
- Pre-Filled DCF Model: Sundaram Finance Limited’s financial data preloaded for immediate analysis.
- WACC Calculator: Comprehensive calculations for Weighted Average Cost of Capital.
- Financial Ratios: Assess Sundaram Finance Limited’s profitability, leverage, and operational efficiency.
- Editable Inputs: Customize assumptions such as growth rates, margins, and CAPEX to align with your scenarios.
- Financial Statements: Access annual and quarterly reports for thorough analysis.
- Interactive Dashboard: Effortlessly visualize essential valuation metrics and outcomes.
Disclaimer
All information, articles, and product details provided on this website are for general informational and educational purposes only. We do not claim any ownership over, nor do we intend to infringe upon, any trademarks, copyrights, logos, brand names, or other intellectual property mentioned or depicted on this site. Such intellectual property remains the property of its respective owners, and any references here are made solely for identification or informational purposes, without implying any affiliation, endorsement, or partnership.
We make no representations or warranties, express or implied, regarding the accuracy, completeness, or suitability of any content or products presented. Nothing on this website should be construed as legal, tax, investment, financial, medical, or other professional advice. In addition, no part of this site—including articles or product references—constitutes a solicitation, recommendation, endorsement, advertisement, or offer to buy or sell any securities, franchises, or other financial instruments, particularly in jurisdictions where such activity would be unlawful.
All content is of a general nature and may not address the specific circumstances of any individual or entity. It is not a substitute for professional advice or services. Any actions you take based on the information provided here are strictly at your own risk. You accept full responsibility for any decisions or outcomes arising from your use of this website and agree to release us from any liability in connection with your use of, or reliance upon, the content or products found herein.