
|
Sundaram Finance Holdings Limited (Sundarmhld.NS) Avaliação DCF |
Totalmente Editável: Adapte-Se Às Suas Necessidades No Excel Ou Planilhas
Design Profissional: Modelos Confiáveis E Padrão Da Indústria
Pré-Construídos Para Uso Rápido E Eficiente
Compatível com MAC/PC, totalmente desbloqueado
Não É Necessária Experiência; Fácil De Seguir
Sundaram Finance Holdings Limited (SUNDARMHLD.NS) Bundle
Procurando determinar o valor intrínseco da Sundaram Finance Holdings Limited? Nossa calculadora DCF (Sundarmhldns) integra dados do mundo real com opções abrangentes de personalização, permitindo ajustar as previsões e fazer escolhas de investimento mais informadas.
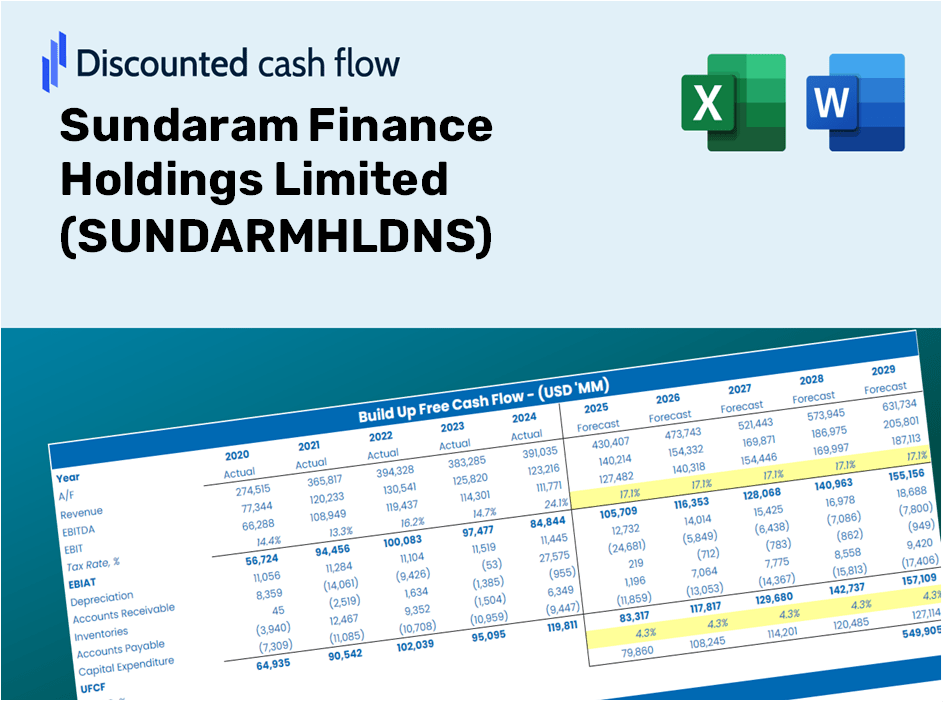
Discounted Cash Flow (DCF) - (USD MM)
| Year | AY1 2021 |
AY2 2022 |
AY3 2023 |
AY4 2024 |
AY5 2025 |
FY1 2026 |
FY2 2027 |
FY3 2028 |
FY4 2029 |
FY5 2030 |
|---|---|---|---|---|---|---|---|---|---|---|
| Revenue | 602.6 | 839.0 | 910.2 | 2,913.2 | 1,549.0 | 1,939.7 | 2,428.9 | 3,041.5 | 3,808.6 | 4,769.1 |
| Revenue Growth, % | 0 | 39.23 | 8.48 | 220.06 | -46.83 | 25.22 | 25.22 | 25.22 | 25.22 | 25.22 |
| EBITDA | 131.2 | 294.6 | 469.0 | 2,426.6 | 1,164.0 | 1,035.2 | 1,296.3 | 1,623.2 | 2,032.6 | 2,545.3 |
| EBITDA, % | 21.78 | 35.11 | 51.53 | 83.3 | 75.14 | 53.37 | 53.37 | 53.37 | 53.37 | 53.37 |
| Depreciation | 9.5 | 38.4 | 7.0 | 6.1 | 7.3 | 29.5 | 36.9 | 46.2 | 57.9 | 72.5 |
| Depreciation, % | 1.58 | 4.58 | 0.76433 | 0.20867 | 0.4741 | 1.52 | 1.52 | 1.52 | 1.52 | 1.52 |
| EBIT | 121.7 | 256.2 | 462.0 | 2,420.6 | 1,156.6 | 1,005.7 | 1,259.4 | 1,577.0 | 1,974.7 | 2,472.8 |
| EBIT, % | 20.2 | 30.53 | 50.76 | 83.09 | 74.67 | 51.85 | 51.85 | 51.85 | 51.85 | 51.85 |
| Total Cash | 113.4 | 2,170.5 | 4,671.1 | 1,820.6 | 159.2 | 1,131.2 | 1,416.5 | 1,773.8 | 2,221.1 | 2,781.3 |
| Total Cash, percent | .0 | .0 | .0 | .0 | .0 | .0 | .0 | .0 | .0 | .0 |
| Account Receivables | 56.1 | 132.3 | 71.4 | 73.6 | 58.4 | 152.1 | 190.5 | 238.5 | 298.7 | 374.0 |
| Account Receivables, % | 9.31 | 15.76 | 7.85 | 2.52 | 3.77 | 7.84 | 7.84 | 7.84 | 7.84 | 7.84 |
| Inventories | .0 | -2,025.6 | -4,505.4 | 7,058.3 | .0 | -387.9 | -485.8 | -608.3 | -761.7 | -953.8 |
| Inventories, % | 0 | -241.41 | -494.99 | 242.29 | 0 | -20 | -20 | -20 | -20 | -20 |
| Accounts Payable | 7.0 | 5.0 | 9.5 | 4.4 | 17.8 | 15.9 | 19.9 | 25.0 | 31.3 | 39.2 |
| Accounts Payable, % | 1.16 | 0.59878 | 1.04 | 0.15066 | 1.15 | 0.8212 | 0.8212 | 0.8212 | 0.8212 | 0.8212 |
| Capital Expenditure | -11.8 | -3.6 | -182.8 | -2.0 | -9.4 | -89.8 | -112.5 | -140.8 | -176.3 | -220.8 |
| Capital Expenditure, % | -1.96 | -0.43049 | -20.08 | -0.06796601 | -0.60915 | -4.63 | -4.63 | -4.63 | -4.63 | -4.63 |
| Tax Rate, % | 8.84 | 8.84 | 8.84 | 8.84 | 8.84 | 8.84 | 8.84 | 8.84 | 8.84 | 8.84 |
| EBITAT | 114.6 | 252.9 | 434.3 | 2,203.6 | 1,054.4 | 943.6 | 1,181.6 | 1,479.6 | 1,852.7 | 2,320.0 |
| Depreciation | ||||||||||
| Changes in Account Receivables | ||||||||||
| Changes in Inventories | ||||||||||
| Changes in Accounts Payable | ||||||||||
| Capital Expenditure | ||||||||||
| UFCF | 63.3 | 2,235.1 | 2,803.6 | -9,363.3 | 8,139.2 | 1,175.6 | 1,169.5 | 1,464.5 | 1,833.8 | 2,296.3 |
| WACC, % | 5.95 | 5.95 | 5.95 | 5.95 | 5.95 | 5.95 | 5.95 | 5.95 | 5.95 | 5.95 |
| PV UFCF | ||||||||||
| SUM PV UFCF | 6,558.5 | |||||||||
| Long Term Growth Rate, % | 2.00 | |||||||||
| Free cash flow (T + 1) | 2,342 | |||||||||
| Terminal Value | 59,332 | |||||||||
| Present Terminal Value | 44,446 | |||||||||
| Enterprise Value | 51,004 | |||||||||
| Net Debt | 2 | |||||||||
| Equity Value | 51,002 | |||||||||
| Diluted Shares Outstanding, MM | 222 | |||||||||
| Equity Value Per Share | 229.63 |
What You Will Receive
- Genuine Sundaram Data: Preloaded financial metrics – including revenue and EBIT – derived from actual and projected figures.
- Complete Customization: Modify key parameters (highlighted cells) such as WACC, growth rates, and tax percentages.
- Immediate Valuation Adjustments: Automatic recalculations to assess the effects of changes on Sundaram Finance Holdings Limited’s (SUNDARMHLDNS) fair value.
- Flexible Excel Template: Designed for easy edits, scenario analysis, and thorough financial projections.
- Efficient and Precise: Avoid building models from scratch while ensuring accuracy and adaptability.
Key Features
- Current SUNDARMHLDNS Data: Pre-populated with Sundaram Finance Holdings Limited’s historical financial performance and future projections.
- Customizable Input Options: Tailor revenue growth rates, margins, WACC, tax rates, and capital expenditures to your needs.
- Dynamic Valuation Framework: Automatically recalculates Net Present Value (NPV) and intrinsic value based on user-defined inputs.
- Scenario Analysis: Develop various forecasting scenarios to examine different valuation results.
- User-Friendly Interface: Easy-to-navigate layout designed for both professionals and novices.
How It Works
- Step 1: Download the Excel file containing financial data for Sundaram Finance Holdings Limited (SUNDARMHLDNS).
- Step 2: Examine the pre-filled financial information and forecasts provided for Sundaram Finance Holdings Limited (SUNDARMHLDNS).
- Step 3: Adjust key inputs such as revenue growth, WACC, and tax rates in the highlighted cells.
- Step 4: Observe the DCF model refresh instantly as you modify your assumptions.
- Step 5: Review the outputs and leverage the findings for your investment decisions regarding Sundaram Finance Holdings Limited (SUNDARMHLDNS).
Why Opt for This Calculator?
- Reliable Data: Utilize authentic financials from Sundaram Finance Holdings Limited (SUNDARMHLDNS) for trustworthy valuation outcomes.
- Customizable Features: Modify essential parameters such as growth rates, WACC, and tax rates to align with your forecasts.
- Efficiency Boost: Built-in calculations save you the time of starting from the ground up.
- Professional Quality: Tailored for investors, analysts, and financial consultants.
- Easy to Use: User-friendly design and straightforward instructions cater to users of all experience levels.
Who Can Benefit from This Product?
- Finance Students: Master valuation methods and practice with real data pertaining to Sundaram Finance Holdings Limited (SUNDARMHLDNS).
- Researchers: Integrate industry-standard models into your academic projects or studies.
- Investors: Challenge your own assumptions and evaluate valuation results for Sundaram Finance Holdings Limited (SUNDARMHLDNS) stock.
- Financial Analysts: Enhance your efficiency with a ready-made, adaptable DCF model tailored for Sundaram Finance Holdings Limited (SUNDARMHLDNS).
- Small Business Owners: Understand the analytical approaches used for assessing large public companies like Sundaram Finance Holdings Limited (SUNDARMHLDNS).
What the Template Contains
- Operating and Balance Sheet Data: Pre-filled historical data and forecasts for Sundaram Finance Holdings Limited (SUNDARMHLDNS), including revenue, EBITDA, EBIT, and capital expenditures.
- WACC Calculation: A dedicated sheet for Weighted Average Cost of Capital (WACC), featuring parameters such as Beta, risk-free rate, and share price.
- DCF Valuation (Unlevered and Levered): Customizable Discounted Cash Flow models that display intrinsic value along with comprehensive calculations.
- Financial Statements: Pre-loaded annual and quarterly financial statements to facilitate thorough analysis.
- Key Ratios: Offers profitability, leverage, and efficiency ratios relevant to Sundaram Finance Holdings Limited (SUNDARMHLDNS).
- Dashboard and Charts: Visual representations of valuation outputs and assumptions, designed for easy analysis of results.
Disclaimer
All information, articles, and product details provided on this website are for general informational and educational purposes only. We do not claim any ownership over, nor do we intend to infringe upon, any trademarks, copyrights, logos, brand names, or other intellectual property mentioned or depicted on this site. Such intellectual property remains the property of its respective owners, and any references here are made solely for identification or informational purposes, without implying any affiliation, endorsement, or partnership.
We make no representations or warranties, express or implied, regarding the accuracy, completeness, or suitability of any content or products presented. Nothing on this website should be construed as legal, tax, investment, financial, medical, or other professional advice. In addition, no part of this site—including articles or product references—constitutes a solicitation, recommendation, endorsement, advertisement, or offer to buy or sell any securities, franchises, or other financial instruments, particularly in jurisdictions where such activity would be unlawful.
All content is of a general nature and may not address the specific circumstances of any individual or entity. It is not a substitute for professional advice or services. Any actions you take based on the information provided here are strictly at your own risk. You accept full responsibility for any decisions or outcomes arising from your use of this website and agree to release us from any liability in connection with your use of, or reliance upon, the content or products found herein.