
|
Supriya LifeScience Limited (supriya.ns) Avaliação DCF |
Totalmente Editável: Adapte-Se Às Suas Necessidades No Excel Ou Planilhas
Design Profissional: Modelos Confiáveis E Padrão Da Indústria
Pré-Construídos Para Uso Rápido E Eficiente
Compatível com MAC/PC, totalmente desbloqueado
Não É Necessária Experiência; Fácil De Seguir
Supriya Lifescience Limited (SUPRIYA.NS) Bundle
Simplifique a avaliação Supriya LifeScience Limited (Supriyans) com esta calculadora DCF personalizável! Apresentando o Real Supriya LifeScience Limited (Supriyans) Financeiros e insumos de previsão ajustável, você pode testar cenários e descobrir o valor justo da Supriya LifeScience Limited (Supriyans) em minutos.
What You Will Receive
- Comprehensive Financial Model: Utilize Supriya Lifescience Limited’s actual data for accurate DCF valuation.
- Complete Forecasting Flexibility: Modify revenue growth, profit margins, WACC, and other essential variables.
- Real-Time Calculations: Automatic updates allow you to view outcomes immediately as adjustments are made.
- Professional-Grade Template: A polished Excel file crafted for high-quality valuation presentations.
- Customizable and Repeatable: Designed for adaptability, this model can be reused for detailed future forecasts.
Key Features
- Pre-Loaded Data: Supriya Lifescience Limited’s historical financial statements and pre-filled forecasts.
- Fully Adjustable Inputs: Modify WACC, tax rates, revenue growth, and EBITDA margins as needed.
- Instant Results: View Supriya Lifescience Limited’s intrinsic value recalculated in real-time.
- Clear Visual Outputs: Dashboard charts showcase valuation results and essential metrics.
- Built for Accuracy: A professional tool tailored for analysts, investors, and finance experts.
How It Works
- Download: Get the pre-prepared Excel file containing Supriya Lifescience Limited’s (SUPRIYANS) financial data.
- Customize: Modify forecasts such as revenue growth, EBITDA %, and WACC to suit your needs.
- Update Automatically: Watch as the intrinsic value and NPV calculations refresh in real-time.
- Test Scenarios: Generate various projections and instantly compare the results.
- Make Decisions: Leverage the valuation findings to inform your investment strategy.
Why Choose Supriya Lifescience Limited (SUPRIYANS)?
- Save Time: Skip the hassle of building financial models from the ground up – our solutions are ready for immediate use.
- Enhance Precision: Access to dependable financial data and calculations minimizes valuation errors.
- Completely Customizable: Adjust the model to align with your unique assumptions and forecasts.
- Simple to Analyze: Intuitive charts and outputs facilitate straightforward analysis of results.
- Preferred by Professionals: Created for experts who prioritize accuracy and functionality.
Who Can Benefit from SUPRIYANS Products?
- Pharmaceutical Students: Explore drug development processes and practical applications with real-world data.
- Researchers: Integrate advanced methodologies into your studies or experimental projects.
- Investors: Evaluate your investment strategies and assess valuation results for Supriya Lifescience Limited (SUPRIYANS).
- Market Analysts: Enhance your analysis with a customizable model tailored for pharmaceutical evaluations.
- Entrepreneurs: Discover how major pharmaceutical firms like Supriya Lifescience Limited (SUPRIYANS) are evaluated in the market.
Overview of the Template's Contents
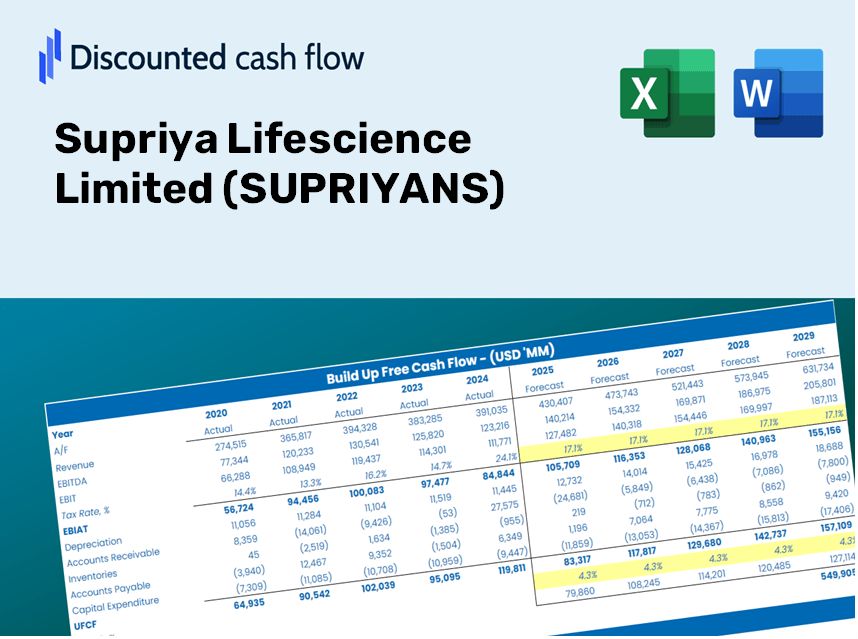
- Preloaded SUPRIYANS Data: Historical and forecasted financial metrics, including revenue, EBIT, and capital expenditures.
- DCF and WACC Models: Expert-level templates for assessing intrinsic value and calculating the Weighted Average Cost of Capital.
- Editable Inputs: Yellow-highlighted fields to modify revenue growth, tax rates, and discount rates as needed.
- Financial Statements: Detailed annual and quarterly financial reports for thorough analysis.
- Key Ratios: Metrics for profitability, leverage, and efficiency to assess overall performance.
- Dashboard and Charts: Visual representations of valuation results and underlying assumptions.
Disclaimer
All information, articles, and product details provided on this website are for general informational and educational purposes only. We do not claim any ownership over, nor do we intend to infringe upon, any trademarks, copyrights, logos, brand names, or other intellectual property mentioned or depicted on this site. Such intellectual property remains the property of its respective owners, and any references here are made solely for identification or informational purposes, without implying any affiliation, endorsement, or partnership.
We make no representations or warranties, express or implied, regarding the accuracy, completeness, or suitability of any content or products presented. Nothing on this website should be construed as legal, tax, investment, financial, medical, or other professional advice. In addition, no part of this site—including articles or product references—constitutes a solicitation, recommendation, endorsement, advertisement, or offer to buy or sell any securities, franchises, or other financial instruments, particularly in jurisdictions where such activity would be unlawful.
All content is of a general nature and may not address the specific circumstances of any individual or entity. It is not a substitute for professional advice or services. Any actions you take based on the information provided here are strictly at your own risk. You accept full responsibility for any decisions or outcomes arising from your use of this website and agree to release us from any liability in connection with your use of, or reliance upon, the content or products found herein.