
|
Avaliação DCF da Suven Pharmaceuticals Limited (Suvenphar.NS) |
Totalmente Editável: Adapte-Se Às Suas Necessidades No Excel Ou Planilhas
Design Profissional: Modelos Confiáveis E Padrão Da Indústria
Pré-Construídos Para Uso Rápido E Eficiente
Compatível com MAC/PC, totalmente desbloqueado
Não É Necessária Experiência; Fácil De Seguir
Suven Pharmaceuticals Limited (SUVENPHAR.NS) Bundle
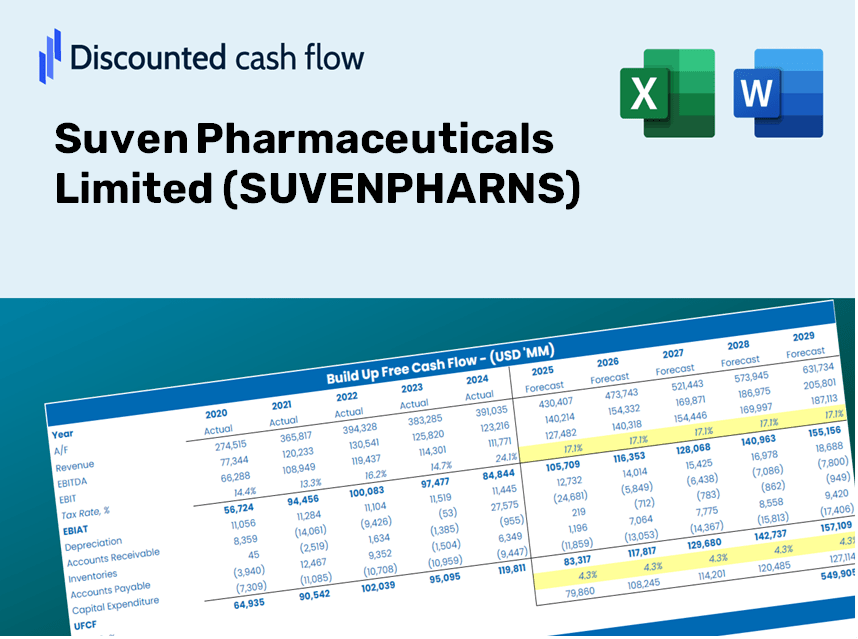
Obtenha informações sobre sua análise de avaliação da Suven Pharmaceuticals Limited (Suvenpharns) com nossa calculadora DCF de última geração! Pré -carregado com dados reais (Suvenpharns), este modelo do Excel permite ajustar as previsões e suposições para determinar com precisão o valor intrínseco da Suven Pharmaceuticals Limited.
What You Will Receive
- Adjustable Forecast Variables: Easily modify assumptions (growth %, profit margins, WACC) to explore various scenarios.
- Real-Time Financial Data: Suven Pharmaceuticals Limited (SUVENPHARNS) financial information pre-filled to enhance your analysis.
- Automated DCF Calculations: The template computes Net Present Value (NPV) and intrinsic value automatically.
- Customizable and Professional Design: A refined Excel model tailored to meet your valuation requirements.
- Designed for Analysts and Investors: Perfect for assessing projections, validating strategies, and increasing efficiency.
Key Features
- Accurate Financial Data: Gain access to reliable pre-loaded historical performance and future forecasts for Suven Pharmaceuticals Limited (SUVENPHARNS).
- Flexible Forecast Assumptions: Modify the yellow-highlighted cells for key parameters such as WACC, growth rates, and profit margins.
- Real-Time Calculations: Enjoy automatic updates for DCF, Net Present Value (NPV), and cash flow assessments.
- User-Friendly Dashboard: Utilize clear charts and summaries to easily interpret your valuation outcomes.
- Designed for All Levels: A straightforward and intuitive framework tailored for investors, CFOs, and consultants.
How It Functions
- Step 1: Download the Excel file.
- Step 2: Examine Suven Pharmaceuticals Limited’s (SUVENPHARNS) pre-filled financial information and projections.
- Step 3: Adjust key inputs such as revenue growth, WACC, and tax rates (highlighted cells).
- Step 4: Observe the DCF model refresh in real-time as you modify the assumptions.
- Step 5: Review the outputs and leverage the insights for your investment strategies.
Why Choose This Calculator for Suven Pharmaceuticals Limited (SUVENPHARNS)?
- Designed for Experts: A sophisticated tool favored by analysts, financial officers, and consultants.
- Accurate Financial Data: Preloaded historical and projected financials for Suven Pharmaceuticals to ensure precision.
- Scenario Analysis: Effortlessly test various forecasts and assumptions.
- Intuitive Outputs: Automatically computes intrinsic value, NPV, and essential metrics.
- User-Friendly: Comprehensive, step-by-step instructions assist you throughout the process.
Who Can Benefit from This Product?
- Investors: Assess Suven Pharmaceuticals Limited's (SUVENPHARNS) valuation before making stock decisions.
- CFOs and Financial Analysts: Optimize valuation workflows and validate forecasts.
- Startup Founders: Discover how established firms like Suven Pharmaceuticals Limited are valued.
- Consultants: Provide detailed valuation reports for your clients involving (SUVENPHARNS).
- Students and Educators: Utilize real market data to explore and teach valuation methods.
Contents of the Template
- Operating and Balance Sheet Data: Pre-filled historical data and forecasts for Suven Pharmaceuticals Limited (SUVENPHARNS), including revenue, EBITDA, EBIT, and capital expenditures.
- WACC Calculation: A separate sheet dedicated to the Weighted Average Cost of Capital (WACC), featuring parameters such as Beta, risk-free rate, and share price.
- DCF Valuation (Unlevered and Levered): Customizable Discounted Cash Flow models that display intrinsic value along with comprehensive calculations.
- Financial Statements: Pre-loaded annual and quarterly financial statements to facilitate thorough analysis.
- Key Ratios: Includes profitability, leverage, and efficiency ratios specific to Suven Pharmaceuticals Limited (SUVENPHARNS).
- Dashboard and Charts: Visual summaries of valuation outputs and assumptions, designed for easy result analysis.
Disclaimer
All information, articles, and product details provided on this website are for general informational and educational purposes only. We do not claim any ownership over, nor do we intend to infringe upon, any trademarks, copyrights, logos, brand names, or other intellectual property mentioned or depicted on this site. Such intellectual property remains the property of its respective owners, and any references here are made solely for identification or informational purposes, without implying any affiliation, endorsement, or partnership.
We make no representations or warranties, express or implied, regarding the accuracy, completeness, or suitability of any content or products presented. Nothing on this website should be construed as legal, tax, investment, financial, medical, or other professional advice. In addition, no part of this site—including articles or product references—constitutes a solicitation, recommendation, endorsement, advertisement, or offer to buy or sell any securities, franchises, or other financial instruments, particularly in jurisdictions where such activity would be unlawful.
All content is of a general nature and may not address the specific circumstances of any individual or entity. It is not a substitute for professional advice or services. Any actions you take based on the information provided here are strictly at your own risk. You accept full responsibility for any decisions or outcomes arising from your use of this website and agree to release us from any liability in connection with your use of, or reliance upon, the content or products found herein.