
|
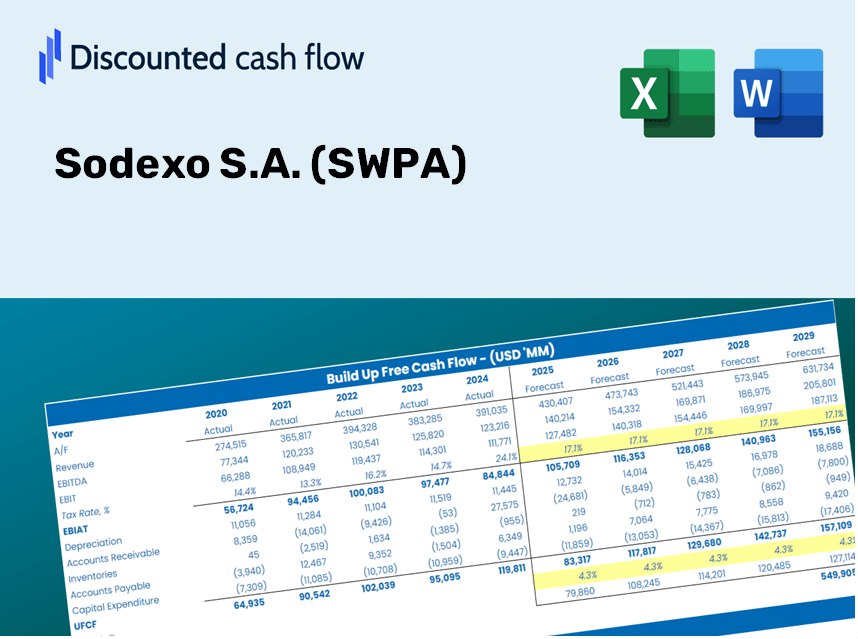
Sodexo S.A. (SW.PA) Avaliação DCF |
Totalmente Editável: Adapte-Se Às Suas Necessidades No Excel Ou Planilhas
Design Profissional: Modelos Confiáveis E Padrão Da Indústria
Pré-Construídos Para Uso Rápido E Eficiente
Compatível com MAC/PC, totalmente desbloqueado
Não É Necessária Experiência; Fácil De Seguir
Sodexo S.A. (SW.PA) Bundle
Avalie as perspectivas financeiras do Sodexo S.A. Como um especialista! Esta calculadora DCF (SWPA) fornece dados financeiros pré-preenchidos e flexibilidade para modificar o crescimento da receita, WACC, margens e outras suposições críticas para se alinhar com suas projeções.
What You Will Receive
- Customizable Excel Template: A fully adjustable Excel-based DCF Calculator featuring pre-filled financial data for Sodexo S.A. (SWPA).
- Accurate Market Data: Historical performance metrics and forward-looking projections (highlighted in the yellow cells).
- Flexible Projections: Modify forecast variables such as revenue growth, EBITDA %, and WACC.
- Instant Calculations: Quickly observe how your adjustments influence the valuation of Sodexo S.A. (SWPA).
- Professional-Grade Tool: Designed for investors, CFOs, consultants, and financial analysts.
- Intuitive Layout: Organized for clarity and ease of navigation, complete with step-by-step guidance.
Key Features
- Comprehensive DCF Calculator: Features in-depth unlevered and levered DCF valuation models tailored for Sodexo S.A. (SWPA).
- WACC Calculator: A pre-designed Weighted Average Cost of Capital sheet with options for personalized inputs.
- Customizable Forecast Assumptions: Adjust growth projections, capital expenditures, and discount rates as needed.
- Integrated Financial Ratios: Evaluate profitability, leverage, and efficiency ratios specifically for Sodexo S.A. (SWPA).
- Interactive Dashboard and Charts: Visual summaries of critical valuation metrics facilitate straightforward analysis.
How It Works
- Download the Template: Gain immediate access to the Excel-based Sodexo S.A. (SWPA) DCF Calculator.
- Input Your Assumptions: Modify the yellow-highlighted cells for growth rates, WACC, margins, and additional factors.
- Instant Calculations: The model automatically refreshes Sodexo's intrinsic value.
- Test Scenarios: Explore various assumptions to assess potential changes in valuation.
- Analyze and Decide: Leverage the results to inform your investment or financial analysis.
Why Opt for This Calculator?
- Designed for Industry Experts: A sophisticated tool tailored for analysts, CFOs, and consultants.
- Real-World Data: Historical and projected financials for Sodexo S.A. (SWPA) preloaded to ensure precision.
- Scenario Analysis: Effortlessly simulate a variety of forecasts and assumptions.
- Clear Outputs: Instantly calculates intrinsic value, NPV, and other essential metrics.
- User-Friendly: Comprehensive step-by-step guidance leads you through the calculation process.
Who Can Benefit from This Product?
- Investors: Accurately assess Sodexo S.A.’s (SWPA) fair value prior to making investment choices.
- CFOs: Utilize a top-tier DCF model for insightful financial reporting and analysis.
- Consultants: Easily customize the template for client valuation reports.
- Entrepreneurs: Gain valuable insights into the financial modeling practices of major corporations.
- Educators: Employ this resource as a teaching aid to illustrate valuation techniques.
What the Template Includes
- Pre-Filled DCF Model: Sodexo S.A. (SWPA) financial data ready for immediate implementation.
- WACC Calculator: Comprehensive calculations for Weighted Average Cost of Capital.
- Financial Ratios: Assess Sodexo S.A. (SWPA)'s profitability, leverage, and operational efficiency.
- Editable Inputs: Modify assumptions such as growth rates, margins, and CAPEX to align with your needs.
- Financial Statements: Access annual and quarterly reports for thorough analysis.
- Interactive Dashboard: Effortlessly visualize essential valuation metrics and outcomes.
Disclaimer
All information, articles, and product details provided on this website are for general informational and educational purposes only. We do not claim any ownership over, nor do we intend to infringe upon, any trademarks, copyrights, logos, brand names, or other intellectual property mentioned or depicted on this site. Such intellectual property remains the property of its respective owners, and any references here are made solely for identification or informational purposes, without implying any affiliation, endorsement, or partnership.
We make no representations or warranties, express or implied, regarding the accuracy, completeness, or suitability of any content or products presented. Nothing on this website should be construed as legal, tax, investment, financial, medical, or other professional advice. In addition, no part of this site—including articles or product references—constitutes a solicitation, recommendation, endorsement, advertisement, or offer to buy or sell any securities, franchises, or other financial instruments, particularly in jurisdictions where such activity would be unlawful.
All content is of a general nature and may not address the specific circumstances of any individual or entity. It is not a substitute for professional advice or services. Any actions you take based on the information provided here are strictly at your own risk. You accept full responsibility for any decisions or outcomes arising from your use of this website and agree to release us from any liability in connection with your use of, or reliance upon, the content or products found herein.