
|
Avaliação DCF Syros Pharmaceuticals, Inc. (SYRS) |
Totalmente Editável: Adapte-Se Às Suas Necessidades No Excel Ou Planilhas
Design Profissional: Modelos Confiáveis E Padrão Da Indústria
Pré-Construídos Para Uso Rápido E Eficiente
Compatível com MAC/PC, totalmente desbloqueado
Não É Necessária Experiência; Fácil De Seguir
Syros Pharmaceuticals, Inc. (SYRS) Bundle
Avalie as perspectivas financeiras da Syros Pharmaceuticals, Inc. (SYRS) como um especialista! Essa calculadora DCF (SYRS) vem com dados financeiros pré-preenchidos e oferece flexibilidade total para modificar o crescimento da receita, WACC, margens e outras suposições essenciais para se alinhar às suas projeções.
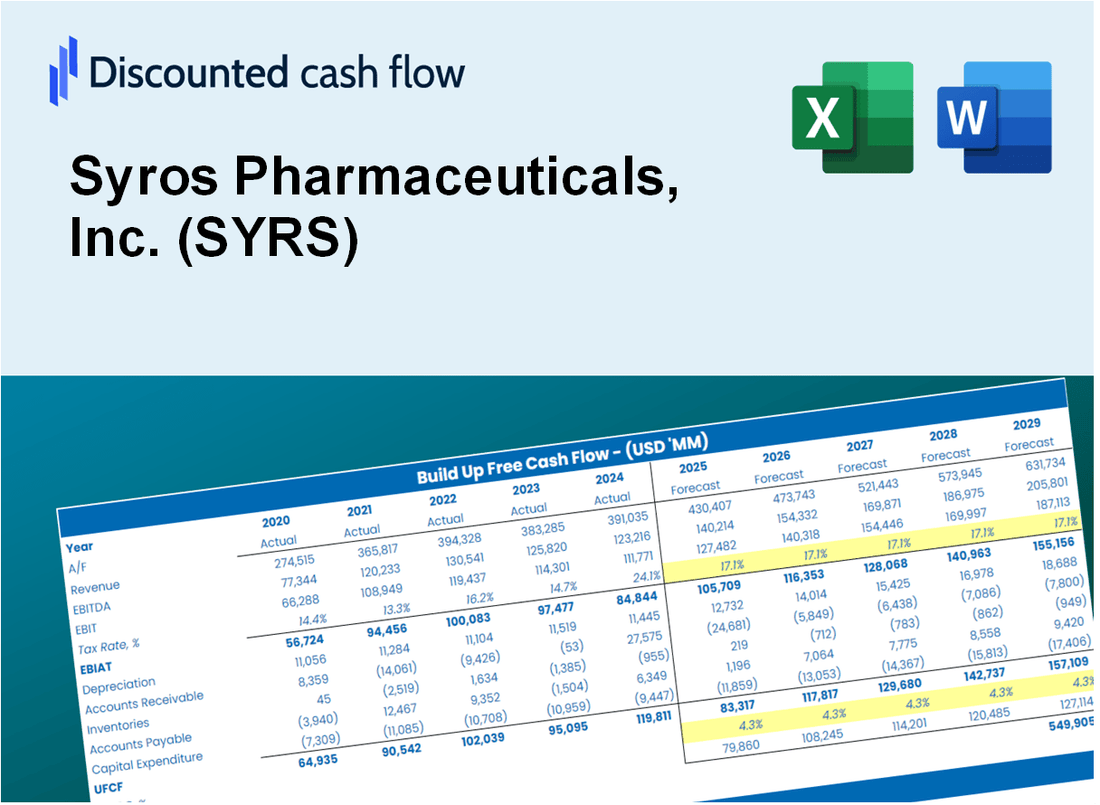
Discounted Cash Flow (DCF) - (USD MM)
| Year | AY1 2019 |
AY2 2020 |
AY3 2021 |
AY4 2022 |
AY5 2023 |
FY1 2024 |
FY2 2025 |
FY3 2026 |
FY4 2027 |
FY5 2028 |
|---|---|---|---|---|---|---|---|---|---|---|
| Revenue | 2.0 | 15.1 | 23.5 | 14.9 | 9.9 | 12.1 | 14.7 | 17.8 | 21.6 | 26.2 |
| Revenue Growth, % | 0 | 661.5 | 55.62 | -36.65 | -33.23 | 21.44 | 21.44 | 21.44 | 21.44 | 21.44 |
| EBITDA | -72.7 | -79.2 | -79.6 | -87.6 | -157.2 | -12.1 | -14.7 | -17.8 | -21.6 | -26.2 |
| EBITDA, % | -3668.82 | -524.82 | -339.04 | -588.39 | -1582.08 | -100 | -100 | -100 | -100 | -100 |
| Depreciation | 2.7 | 3.0 | 3.0 | 3.0 | 2.3 | 4.2 | 5.1 | 6.2 | 7.6 | 9.2 |
| Depreciation, % | 137.34 | 20.11 | 12.85 | 19.94 | 22.67 | 35.11 | 35.11 | 35.11 | 35.11 | 35.11 |
| EBIT | -75.4 | -82.2 | -82.7 | -90.5 | -159.4 | -12.1 | -14.7 | -17.8 | -21.6 | -26.2 |
| EBIT, % | -3806.16 | -544.93 | -351.89 | -608.33 | -1604.74 | -100 | -100 | -100 | -100 | -100 |
| Total Cash | 91.4 | 174.0 | 130.4 | 202.3 | 139.5 | 12.1 | 14.7 | 17.8 | 21.6 | 26.2 |
| Total Cash, percent | .0 | .0 | .0 | .0 | .0 | .0 | .0 | .0 | .0 | .0 |
| Account Receivables | 20.2 | 2.3 | 3.0 | 1.7 | .0 | 3.4 | 4.1 | 5.0 | 6.0 | 7.3 |
| Account Receivables, % | 1017.05 | 15.44 | 12.68 | 11.38 | 0 | 27.9 | 27.9 | 27.9 | 27.9 | 27.9 |
| Inventories | .3 | .0 | .0 | .0 | .0 | .4 | .4 | .5 | .6 | .8 |
| Inventories, % | 14.63 | 0 | 0 | 0 | 0 | 2.93 | 2.93 | 2.93 | 2.93 | 2.93 |
| Accounts Payable | 5.9 | 3.6 | 3.7 | 6.4 | 11.5 | 6.8 | 8.3 | 10.1 | 12.2 | 14.8 |
| Accounts Payable, % | 295.31 | 23.87 | 15.72 | 43.08 | 116.18 | 56.54 | 56.54 | 56.54 | 56.54 | 56.54 |
| Capital Expenditure | -12.6 | -3.3 | -1.2 | -1.2 | -.3 | -3.3 | -4.1 | -4.9 | -6.0 | -7.3 |
| Capital Expenditure, % | -637.64 | -22.1 | -5.3 | -8.34 | -2.74 | -27.7 | -27.7 | -27.7 | -27.7 | -27.7 |
| Tax Rate, % | 0 | 0 | 0 | 0 | 0 | 0 | 0 | 0 | 0 | 0 |
| EBITAT | -75.4 | -82.2 | -82.7 | -90.5 | -159.4 | -12.1 | -14.7 | -17.8 | -21.6 | -26.2 |
| Depreciation | ||||||||||
| Changes in Account Receivables | ||||||||||
| Changes in Inventories | ||||||||||
| Changes in Accounts Payable | ||||||||||
| Capital Expenditure | ||||||||||
| UFCF | -99.9 | -66.7 | -81.4 | -84.8 | -150.6 | -19.6 | -12.9 | -15.7 | -19.0 | -23.1 |
| WACC, % | 8.26 | 8.26 | 8.26 | 8.26 | 8.26 | 8.26 | 8.26 | 8.26 | 8.26 | 8.26 |
| PV UFCF | ||||||||||
| SUM PV UFCF | -70.9 | |||||||||
| Long Term Growth Rate, % | 2.00 | |||||||||
| Free cash flow (T + 1) | -24 | |||||||||
| Terminal Value | -376 | |||||||||
| Present Terminal Value | -253 | |||||||||
| Enterprise Value | -324 | |||||||||
| Net Debt | -77 | |||||||||
| Equity Value | -247 | |||||||||
| Diluted Shares Outstanding, MM | 28 | |||||||||
| Equity Value Per Share | -8.70 |
What You Will Get
- Editable Forecast Inputs: Easily modify key assumptions (growth %, margins, WACC) to explore various scenarios.
- Real-World Data: Syros Pharmaceuticals’ financial data pre-filled to kickstart your analysis.
- Automatic DCF Outputs: The template automatically computes Net Present Value (NPV) and intrinsic value for you.
- Customizable and Professional: A refined Excel model that adjusts to your valuation requirements.
- Built for Analysts and Investors: Perfect for evaluating projections, assessing strategies, and enhancing efficiency.
Key Features
- Customizable Research Parameters: Adjust essential inputs such as drug development timelines, market penetration rates, and R&D expenditures.
- Instant Valuation Metrics: Automatically computes intrinsic value, risk-adjusted NPV, and other key financial indicators.
- High-Precision Analytics: Leverages Syros Pharmaceuticals’ actual financial data for accurate valuation results.
- Streamlined Scenario Testing: Easily evaluate various hypotheses and analyze the resulting impacts.
- Efficiency-Boosting Tool: Avoid the complexity of creating detailed financial models from the ground up.
How It Works
- Download: Obtain the comprehensive Excel file featuring Syros Pharmaceuticals, Inc. (SYRS) financial data.
- Customize: Modify projections, including anticipated revenue growth, EBITDA %, and WACC.
- Update Automatically: The intrinsic value and NPV calculations refresh in real-time.
- Test Scenarios: Develop various projections and instantly analyze different outcomes.
- Make Decisions: Leverage the valuation results to inform your investment approach.
Why Choose This Calculator for Syros Pharmaceuticals, Inc. (SYRS)?
- User-Friendly Interface: Tailored for both novices and seasoned analysts.
- Customizable Inputs: Easily adjust parameters to suit your financial assessments.
- Real-Time Feedback: Observe immediate changes to Syros' valuation as you modify inputs.
- Preloaded Financials: Comes equipped with Syros' current financial data for swift evaluations.
- Relied Upon by Experts: Utilized by investors and financial analysts for informed decision-making.
Who Should Use This Product?
- Investors: Evaluate Syros Pharmaceuticals' valuation before making stock transactions.
- CFOs and Financial Analysts: Optimize valuation methodologies and assess financial forecasts.
- Startup Founders: Understand how biotech companies like Syros Pharmaceuticals are appraised.
- Consultants: Provide expert valuation reports tailored for clients in the pharmaceutical sector.
- Students and Educators: Utilize real-time data to learn and instruct on valuation strategies.
What the Template Contains
- Preloaded SYRS Data: Historical and projected financial data, including revenue, EBIT, and capital expenditures.
- DCF and WACC Models: Professional-grade sheets for calculating intrinsic value and Weighted Average Cost of Capital.
- Editable Inputs: Yellow-highlighted cells for adjusting revenue growth, tax rates, and discount rates.
- Financial Statements: Comprehensive annual and quarterly financials for deeper analysis.
- Key Ratios: Profitability, leverage, and efficiency ratios to evaluate performance.
- Dashboard and Charts: Visual summaries of valuation outcomes and assumptions.
Disclaimer
All information, articles, and product details provided on this website are for general informational and educational purposes only. We do not claim any ownership over, nor do we intend to infringe upon, any trademarks, copyrights, logos, brand names, or other intellectual property mentioned or depicted on this site. Such intellectual property remains the property of its respective owners, and any references here are made solely for identification or informational purposes, without implying any affiliation, endorsement, or partnership.
We make no representations or warranties, express or implied, regarding the accuracy, completeness, or suitability of any content or products presented. Nothing on this website should be construed as legal, tax, investment, financial, medical, or other professional advice. In addition, no part of this site—including articles or product references—constitutes a solicitation, recommendation, endorsement, advertisement, or offer to buy or sell any securities, franchises, or other financial instruments, particularly in jurisdictions where such activity would be unlawful.
All content is of a general nature and may not address the specific circumstances of any individual or entity. It is not a substitute for professional advice or services. Any actions you take based on the information provided here are strictly at your own risk. You accept full responsibility for any decisions or outcomes arising from your use of this website and agree to release us from any liability in connection with your use of, or reliance upon, the content or products found herein.