
|
Tarc Limited (Tarc.NS) Avaliação DCF |
Totalmente Editável: Adapte-Se Às Suas Necessidades No Excel Ou Planilhas
Design Profissional: Modelos Confiáveis E Padrão Da Indústria
Pré-Construídos Para Uso Rápido E Eficiente
Compatível com MAC/PC, totalmente desbloqueado
Não É Necessária Experiência; Fácil De Seguir
TARC Limited (TARC.NS) Bundle
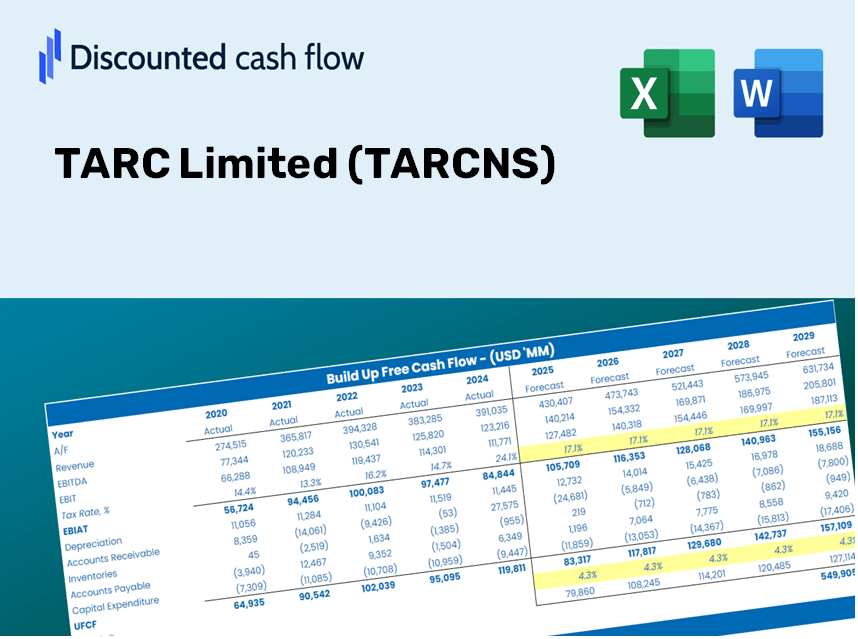
Projetado para precisão, a calculadora DCF TARC LIMITED (TARCNS) permite avaliar a avaliação da Tarc Limited usando dados financeiros do mundo real, oferecendo flexibilidade completa para modificar todos os parâmetros essenciais para obter previsões aprimoradas.
Discounted Cash Flow (DCF) - (USD MM)
| Year | AY1 2021 |
AY2 2022 |
AY3 2023 |
AY4 2024 |
AY5 2025 |
FY1 2026 |
FY2 2027 |
FY3 2028 |
FY4 2029 |
FY5 2030 |
|---|---|---|---|---|---|---|---|---|---|---|
| Revenue | 1,909.6 | 954.5 | 1,845.2 | 1,121.8 | 336.9 | 281.4 | 235.1 | 196.3 | 164.0 | 137.0 |
| Revenue Growth, % | 0 | -50.01 | 93.31 | -39.21 | -69.97 | -16.47 | -16.47 | -16.47 | -16.47 | -16.47 |
| EBITDA | 20.3 | -1,460.6 | 1,653.7 | 561.2 | -1,277.7 | -33.4 | -27.9 | -23.3 | -19.4 | -16.2 |
| EBITDA, % | 1.07 | -153.01 | 89.62 | 50.03 | -379.27 | -11.86 | -11.86 | -11.86 | -11.86 | -11.86 |
| Depreciation | 81.6 | 86.6 | 71.9 | 64.9 | 89.9 | 28.0 | 23.4 | 19.5 | 16.3 | 13.6 |
| Depreciation, % | 4.27 | 9.08 | 3.9 | 5.78 | 26.67 | 9.94 | 9.94 | 9.94 | 9.94 | 9.94 |
| EBIT | -61.3 | -1,547.2 | 1,581.7 | 496.3 | -1,367.6 | -41.2 | -34.4 | -28.8 | -24.0 | -20.1 |
| EBIT, % | -3.21 | -162.09 | 85.72 | 44.24 | -405.95 | -14.65 | -14.65 | -14.65 | -14.65 | -14.65 |
| Total Cash | 118.8 | 193.5 | 1,058.0 | 588.4 | 2,045.1 | 133.0 | 111.1 | 92.8 | 77.5 | 64.7 |
| Total Cash, percent | .0 | .0 | .0 | .0 | .0 | .0 | .0 | .0 | .0 | .0 |
| Account Receivables | 168.7 | 48.1 | 1.1 | 62.2 | 324.4 | 65.2 | 54.4 | 45.5 | 38.0 | 31.7 |
| Account Receivables, % | 8.84 | 5.04 | 0.059234 | 5.54 | 96.3 | 23.16 | 23.16 | 23.16 | 23.16 | 23.16 |
| Inventories | 8,478.4 | 10,875.0 | 11,062.0 | 13,847.3 | 19,514.4 | 281.4 | 235.1 | 196.3 | 164.0 | 137.0 |
| Inventories, % | 443.99 | 1139.3 | 599.49 | 1234.42 | 5792.58 | 100 | 100 | 100 | 100 | 100 |
| Accounts Payable | 515.1 | 416.5 | 239.9 | 246.9 | 614.4 | 115.7 | 96.7 | 80.7 | 67.4 | 56.3 |
| Accounts Payable, % | 26.97 | 43.64 | 13 | 22.01 | 182.37 | 41.12 | 41.12 | 41.12 | 41.12 | 41.12 |
| Capital Expenditure | -185.9 | 2,322.4 | -65.9 | -409.8 | -372.5 | -84.3 | -70.4 | -58.8 | -49.2 | -41.1 |
| Capital Expenditure, % | -9.74 | 243.3 | -3.57 | -36.53 | -110.58 | -29.97 | -29.97 | -29.97 | -29.97 | -29.97 |
| Tax Rate, % | 4.92 | 4.92 | 4.92 | 4.92 | 4.92 | 4.92 | 4.92 | 4.92 | 4.92 | 4.92 |
| EBITAT | -408.1 | -1,570.2 | 781.9 | 444.5 | -1,300.2 | -35.8 | -29.9 | -25.0 | -20.9 | -17.4 |
| Depreciation | ||||||||||
| Changes in Account Receivables | ||||||||||
| Changes in Inventories | ||||||||||
| Changes in Accounts Payable | ||||||||||
| Capital Expenditure | ||||||||||
| UFCF | -8,644.4 | -1,535.8 | 471.3 | -2,739.8 | -7,144.7 | 18,901.5 | -39.0 | -32.5 | -27.2 | -22.7 |
| WACC, % | 4.82 | 4.82 | 3.95 | 4.64 | 4.74 | 4.6 | 4.6 | 4.6 | 4.6 | 4.6 |
| PV UFCF | ||||||||||
| SUM PV UFCF | 17,966.1 | |||||||||
| Long Term Growth Rate, % | 2.00 | |||||||||
| Free cash flow (T + 1) | -23 | |||||||||
| Terminal Value | -892 | |||||||||
| Present Terminal Value | -713 | |||||||||
| Enterprise Value | 17,254 | |||||||||
| Net Debt | 19,058 | |||||||||
| Equity Value | -1,804 | |||||||||
| Diluted Shares Outstanding, MM | 295 | |||||||||
| Equity Value Per Share | -6.12 |
What You Will Receive
- Customizable Excel Template: A fully adjustable Excel-based DCF Calculator featuring pre-filled historical financials for TARC Limited (TARCNS).
- Real-World Insights: Access to historical data and forward-looking projections (highlighted in the yellow cells).
- Flexible Forecasting: Modify key assumptions such as revenue growth, EBITDA margin, and WACC.
- Instant Calculations: Quickly visualize how your inputs affect TARC Limited’s (TARCNS) valuation.
- Professional Resource: Designed for investors, CFOs, consultants, and financial analysts.
- Intuitive Design: Organized for ease of understanding and use, complete with step-by-step guidance.
Key Features
- Authentic TARC Data: Comes pre-loaded with TARC Limited's historical financial performance and future projections.
- Fully Customizable Parameters: Tailor aspects like revenue growth, profit margins, WACC, tax rates, and capital expenditures to your needs.
- Adaptive Valuation Model: Automatically refreshes Net Present Value (NPV) and intrinsic value based on your customized inputs.
- Scenario Analysis: Develop various forecasting scenarios to evaluate different potential valuation outcomes.
- User-Friendly Interface: Designed to be intuitive and accessible for both seasoned professionals and newcomers.
How It Operates
- Download the Template: Gain immediate access to the Excel-based TARC DCF Calculator.
- Input Your Assumptions: Modify the yellow-highlighted cells for growth rates, WACC, margins, and other parameters.
- Instant Calculations: The model automatically recalculates TARC’s intrinsic value.
- Test Scenarios: Experiment with different assumptions to assess potential changes in valuation.
- Analyze and Decide: Utilize the outcomes to inform your investment or financial analysis.
Why Choose This Calculator for TARC Limited (TARCNS)?
- User-Friendly Interface: Perfectly crafted for both novices and seasoned users.
- Customizable Assumptions: Effortlessly adjust inputs to suit your specific analysis needs.
- Real-Time Updates: Instantly view changes in TARC Limited’s valuation as you modify inputs.
- Pre-Loaded Data: Comes equipped with TARC Limited’s actual financial information for rapid assessments.
- Relied Upon by Experts: A go-to tool for investors and analysts aiming to make well-informed decisions.
Who Can Benefit from TARC Limited (TARCNS)?
- Investors: Evaluate TARC's valuation prior to making stock transactions.
- CFOs and Financial Analysts: Optimize valuation workflows and validate financial projections.
- Startup Founders: Gain insights into how established companies like TARC are valued.
- Consultants: Create comprehensive valuation reports for your clientele.
- Students and Educators: Apply real-time data to refine and instruct valuation methodologies.
Contents of the Template
- Historical Data: Features TARC Limited's past financial performance and baseline projections.
- DCF and Levered DCF Models: Comprehensive templates for assessing the intrinsic value of TARC Limited (TARCNS).
- WACC Sheet: Ready-to-use calculations for Weighted Average Cost of Capital.
- Editable Inputs: Adjust essential drivers such as growth rates, EBITDA percentages, and CAPEX estimates.
- Quarterly and Annual Statements: A thorough analysis of TARC Limited's financial statements.
- Interactive Dashboard: Dynamic visualization of valuation outcomes and forecasts.
Disclaimer
All information, articles, and product details provided on this website are for general informational and educational purposes only. We do not claim any ownership over, nor do we intend to infringe upon, any trademarks, copyrights, logos, brand names, or other intellectual property mentioned or depicted on this site. Such intellectual property remains the property of its respective owners, and any references here are made solely for identification or informational purposes, without implying any affiliation, endorsement, or partnership.
We make no representations or warranties, express or implied, regarding the accuracy, completeness, or suitability of any content or products presented. Nothing on this website should be construed as legal, tax, investment, financial, medical, or other professional advice. In addition, no part of this site—including articles or product references—constitutes a solicitation, recommendation, endorsement, advertisement, or offer to buy or sell any securities, franchises, or other financial instruments, particularly in jurisdictions where such activity would be unlawful.
All content is of a general nature and may not address the specific circumstances of any individual or entity. It is not a substitute for professional advice or services. Any actions you take based on the information provided here are strictly at your own risk. You accept full responsibility for any decisions or outcomes arising from your use of this website and agree to release us from any liability in connection with your use of, or reliance upon, the content or products found herein.