
|
Tarso Pharmaceuticals, Inc. (Tars) DCF Avaliação |
Totalmente Editável: Adapte-Se Às Suas Necessidades No Excel Ou Planilhas
Design Profissional: Modelos Confiáveis E Padrão Da Indústria
Pré-Construídos Para Uso Rápido E Eficiente
Compatível com MAC/PC, totalmente desbloqueado
Não É Necessária Experiência; Fácil De Seguir
Tarsus Pharmaceuticals, Inc. (TARS) Bundle
Aprimore suas estratégias de investimento com a calculadora DCF da Tarso Pharmaceuticals, Inc. (TARS)! Mergulhe em dados financeiros autênticos do Tarso, ajuste as projeções e despesas de crescimento e observe instantaneamente como essas alterações afetam o valor intrínseco de Tarso Pharmaceuticals, Inc. (TARS).
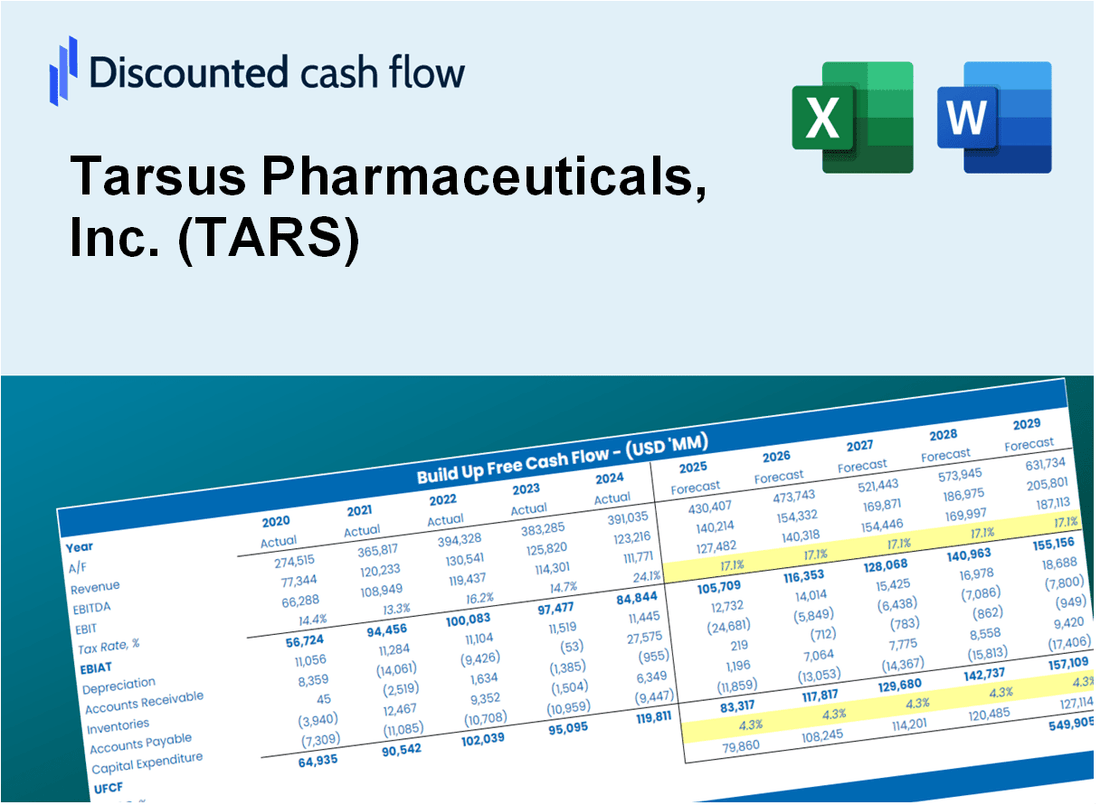
Discounted Cash Flow (DCF) - (USD MM)
| Year | AY1 2020 |
AY2 2021 |
AY3 2022 |
AY4 2023 |
AY5 2024 |
FY1 2025 |
FY2 2026 |
FY3 2027 |
FY4 2028 |
FY5 2029 |
|---|---|---|---|---|---|---|---|---|---|---|
| Revenue | .0 | 57.0 | 25.8 | 17.4 | 183.0 | 188.8 | 194.9 | 201.2 | 207.6 | 214.3 |
| Revenue Growth, % | 0 | 0 | -54.73 | -32.42 | 948.62 | 3.21 | 3.21 | 3.21 | 3.21 | 3.21 |
| EBITDA | -26.6 | -13.5 | -59.7 | -131.7 | -106.5 | -68.7 | -70.9 | -73.1 | -75.5 | -77.9 |
| EBITDA, % | 100 | -23.6 | -231.27 | -754.69 | -58.2 | -36.36 | -36.36 | -36.36 | -36.36 | -36.36 |
| Depreciation | .2 | .3 | .3 | .9 | 1.2 | 40.6 | 41.9 | 43.3 | 44.6 | 46.1 |
| Depreciation, % | 100 | 0.54711 | 1.26 | 5.03 | 0.66957 | 21.5 | 21.5 | 21.5 | 21.5 | 21.5 |
| EBIT | -26.8 | -13.8 | -60.0 | -132.5 | -107.7 | -69.1 | -71.3 | -73.6 | -76.0 | -78.4 |
| EBIT, % | 100 | -24.15 | -232.53 | -759.71 | -58.87 | -36.6 | -36.6 | -36.6 | -36.6 | -36.6 |
| Total Cash | 168.1 | 171.8 | 217.0 | 227.4 | 291.4 | 188.8 | 194.9 | 201.2 | 207.6 | 214.3 |
| Total Cash, percent | .0 | .0 | .0 | .0 | .0 | .0 | .0 | .0 | .0 | .0 |
| Account Receivables | .0 | .1 | 3.6 | 17.7 | 48.1 | 90.8 | 93.7 | 96.7 | 99.8 | 103.0 |
| Account Receivables, % | 100 | 0.16133 | 13.88 | 101.53 | 26.27 | 48.06 | 48.06 | 48.06 | 48.06 | 48.06 |
| Inventories | .0 | .0 | .0 | 3.1 | 2.6 | 45.0 | 46.5 | 48.0 | 49.5 | 51.1 |
| Inventories, % | 100 | 0 | 0 | 17.81 | 1.43 | 23.85 | 23.85 | 23.85 | 23.85 | 23.85 |
| Accounts Payable | 2.2 | 2.9 | 5.5 | 17.8 | 27.7 | 91.2 | 94.1 | 97.1 | 100.3 | 103.5 |
| Accounts Payable, % | 100 | 5.01 | 21.3 | 101.86 | 15.16 | 48.29 | 48.29 | 48.29 | 48.29 | 48.29 |
| Capital Expenditure | -.5 | -.6 | -.5 | -5.5 | -1.6 | -13.4 | -13.8 | -14.2 | -14.7 | -15.2 |
| Capital Expenditure, % | 100 | -1.03 | -1.96 | -31.54 | -0.8565 | -7.08 | -7.08 | -7.08 | -7.08 | -7.08 |
| Tax Rate, % | 0 | 0 | 0 | 0 | 0 | 0 | 0 | 0 | 0 | 0 |
| EBITAT | -26.8 | -13.8 | -60.0 | -132.5 | -107.7 | -69.1 | -71.3 | -73.6 | -76.0 | -78.4 |
| Depreciation | ||||||||||
| Changes in Account Receivables | ||||||||||
| Changes in Inventories | ||||||||||
| Changes in Accounts Payable | ||||||||||
| Capital Expenditure | ||||||||||
| UFCF | -24.8 | -13.6 | -61.1 | -142.1 | -127.9 | -63.5 | -44.7 | -46.1 | -47.6 | -49.1 |
| WACC, % | 7.41 | 7.41 | 7.41 | 7.41 | 7.41 | 7.41 | 7.41 | 7.41 | 7.41 | 7.41 |
| PV UFCF | ||||||||||
| SUM PV UFCF | -205.2 | |||||||||
| Long Term Growth Rate, % | 2.00 | |||||||||
| Free cash flow (T + 1) | -50 | |||||||||
| Terminal Value | -926 | |||||||||
| Present Terminal Value | -648 | |||||||||
| Enterprise Value | -853 | |||||||||
| Net Debt | -22 | |||||||||
| Equity Value | -831 | |||||||||
| Diluted Shares Outstanding, MM | 38 | |||||||||
| Equity Value Per Share | -22.09 |
What You Will Receive
- Adjustable Forecast Parameters: Effortlessly modify assumptions (growth %, margins, WACC) to explore various scenarios.
- Current Market Data: Tarsus Pharmaceuticals, Inc. (TARS) financial information pre-loaded to facilitate your analysis.
- Instant DCF Calculations: The template automatically computes Net Present Value (NPV) and intrinsic value for your convenience.
- Tailored and Professional: A sleek Excel model that conforms to your valuation requirements.
- Designed for Analysts and Investors: Perfect for evaluating projections, confirming strategies, and enhancing efficiency.
Key Features
- 🔍 Real-Life TARS Financials: Pre-filled historical and projected data for Tarsus Pharmaceuticals, Inc. (TARS).
- ✏️ Fully Customizable Inputs: Adjust all critical parameters (yellow cells) like WACC, growth %, and tax rates.
- 📊 Professional DCF Valuation: Built-in formulas calculate Tarsus’s intrinsic value using the Discounted Cash Flow method.
- ⚡ Instant Results: Visualize Tarsus’s valuation instantly after making changes.
- Scenario Analysis: Test and compare outcomes for various financial assumptions side-by-side.
How It Works
- Download the Template: Gain immediate access to the Excel-based TARS DCF Calculator.
- Input Your Assumptions: Modify the yellow-highlighted cells for growth rates, WACC, margins, and additional variables.
- Instant Calculations: The model will automatically refresh Tarsus Pharmaceuticals' intrinsic value.
- Test Scenarios: Experiment with various assumptions to assess potential valuation shifts.
- Analyze and Decide: Utilize the outcomes to inform your investment or financial analysis.
Why Choose This Calculator for Tarsus Pharmaceuticals, Inc. (TARS)?
- User-Friendly Interface: Perfectly crafted for both novices and seasoned professionals.
- Customizable Inputs: Adjust assumptions effortlessly to suit your financial analysis.
- Real-Time Feedback: Witness immediate changes in Tarsus’ valuation as you tweak the parameters.
- Preloaded Data: Comes equipped with Tarsus’ actual financial statistics for swift evaluations.
- Relied Upon by Experts: Favored by investors and analysts for making well-informed choices.
Who Should Use This Product?
- Pharmaceutical Students: Explore drug development processes and apply theoretical knowledge with real-world examples.
- Researchers: Integrate advanced models into your studies or clinical trials.
- Investors: Evaluate your investment strategies and analyze market performance for Tarsus Pharmaceuticals, Inc. (TARS).
- Market Analysts: Enhance your analysis with a ready-to-use, adaptable financial model.
- Healthcare Professionals: Understand how biopharmaceutical companies like Tarsus are assessed in the market.
What the Template Contains
- Operating and Balance Sheet Data: Pre-filled Tarsus Pharmaceuticals historical data and forecasts, including revenue, EBITDA, EBIT, and capital expenditures.
- WACC Calculation: A dedicated sheet for Weighted Average Cost of Capital (WACC), including parameters like Beta, risk-free rate, and share price.
- DCF Valuation (Unlevered and Levered): Editable Discounted Cash Flow models showing intrinsic value with detailed calculations.
- Financial Statements: Pre-loaded financial statements (annual and quarterly) to support analysis.
- Key Ratios: Includes profitability, leverage, and efficiency ratios for Tarsus Pharmaceuticals, Inc. (TARS).
- Dashboard and Charts: Visual summary of valuation outputs and assumptions to analyze results easily.
Disclaimer
All information, articles, and product details provided on this website are for general informational and educational purposes only. We do not claim any ownership over, nor do we intend to infringe upon, any trademarks, copyrights, logos, brand names, or other intellectual property mentioned or depicted on this site. Such intellectual property remains the property of its respective owners, and any references here are made solely for identification or informational purposes, without implying any affiliation, endorsement, or partnership.
We make no representations or warranties, express or implied, regarding the accuracy, completeness, or suitability of any content or products presented. Nothing on this website should be construed as legal, tax, investment, financial, medical, or other professional advice. In addition, no part of this site—including articles or product references—constitutes a solicitation, recommendation, endorsement, advertisement, or offer to buy or sell any securities, franchises, or other financial instruments, particularly in jurisdictions where such activity would be unlawful.
All content is of a general nature and may not address the specific circumstances of any individual or entity. It is not a substitute for professional advice or services. Any actions you take based on the information provided here are strictly at your own risk. You accept full responsibility for any decisions or outcomes arising from your use of this website and agree to release us from any liability in connection with your use of, or reliance upon, the content or products found herein.