
|
A Tata Power Company Limited (Tatapower.NS) DCF Avaliação |
Totalmente Editável: Adapte-Se Às Suas Necessidades No Excel Ou Planilhas
Design Profissional: Modelos Confiáveis E Padrão Da Indústria
Pré-Construídos Para Uso Rápido E Eficiente
Compatível com MAC/PC, totalmente desbloqueado
Não É Necessária Experiência; Fácil De Seguir
The Tata Power Company Limited (TATAPOWER.NS) Bundle
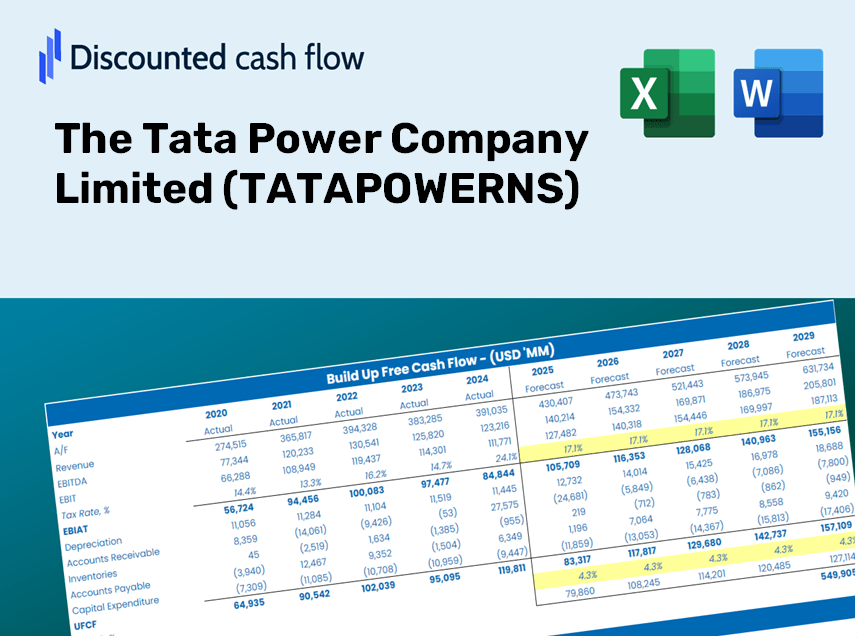
Projetado para precisão, nossa calculadora DCF (Tatapowerns) capacita você a avaliar a avaliação da Tata Power Company Limited usando dados financeiros do mundo real, oferecendo flexibilidade completa para modificar todos os parâmetros essenciais para projeções aprimoradas.
What You Will Receive
- Comprehensive Financial Model: Leverage Tata Power’s actual data for accurate DCF valuation.
- Complete Forecast Customization: Modify revenue growth, profit margins, WACC, and other critical metrics.
- Real-Time Calculations: Instant updates allow you to view results immediately as adjustments are made.
- Professional-Grade Template: An optimized Excel file crafted for high-quality valuation presentations.
- Versatile and Reusable: Designed for adaptability, making it suitable for multiple detailed forecasts.
Key Features
- Current TATA Power Data: Pre-filled with Tata Power’s historical financials and forward-looking projections.
- Completely Customizable Inputs: Modify revenue growth, profit margins, WACC, tax rates, and capital expenditures.
- Dynamic Valuation Model: Automatically updates Net Present Value (NPV) and intrinsic value based on your parameters.
- Scenario Analysis: Develop multiple forecasting scenarios to evaluate various valuation outcomes.
- User-Friendly Interface: Intuitive, well-structured, suitable for both professionals and newcomers.
How It Works
- 1. Access the Template: Download and open the Excel file containing Tata Power's (TATAPOWERNS) preloaded data.
- 2. Modify Assumptions: Adjust key parameters such as growth rates, WACC, and capital expenditures.
- 3. View Outcomes Instantly: The DCF model automatically calculates the intrinsic value and NPV based on your inputs.
- 4. Explore Scenarios: Analyze various forecasts to understand different valuation results.
- 5. Present with Assurance: Share professional valuation insights to back up your investment decisions.
Why Opt for This Calculator?
- All-in-One Solution: Combines DCF, WACC, and financial ratio assessments for a comprehensive analysis.
- Flexible Inputs: Modify the highlighted fields to explore different scenarios.
- In-Depth Analysis: Automatically computes Tata Power's intrinsic value and Net Present Value.
- Ready-to-Use Data: Features historical and projected data for reliable starting points.
- High-Quality Standards: Perfect for financial analysts, investors, and business advisors.
Who Should Use This Product?
- Finance Students: Master valuation techniques and apply them to real-world data sets.
- Academics: Integrate established models into your lessons or research projects.
- Investors: Evaluate your own hypotheses and analyze valuation results for Tata Power Company Limited (TATAPOWERNS).
- Analysts: Enhance your efficiency with a customizable, ready-to-use DCF model.
- Small Business Owners: Understand the analytical approaches used for assessing large public enterprises like Tata Power Company Limited (TATAPOWERNS).
What the Template Contains
- Historical Data: Contains Tata Power's past financial performance and foundational forecasts.
- DCF and Levered DCF Models: Comprehensive templates for assessing Tata Power's intrinsic value.
- WACC Sheet: Pre-configured calculations for Weighted Average Cost of Capital.
- Editable Inputs: Adjust crucial drivers such as growth rates, EBITDA %, and CAPEX projections.
- Quarterly and Annual Statements: A thorough analysis of Tata Power's financial data.
- Interactive Dashboard: Visualize valuation outcomes and predictions in an engaging manner.
Disclaimer
All information, articles, and product details provided on this website are for general informational and educational purposes only. We do not claim any ownership over, nor do we intend to infringe upon, any trademarks, copyrights, logos, brand names, or other intellectual property mentioned or depicted on this site. Such intellectual property remains the property of its respective owners, and any references here are made solely for identification or informational purposes, without implying any affiliation, endorsement, or partnership.
We make no representations or warranties, express or implied, regarding the accuracy, completeness, or suitability of any content or products presented. Nothing on this website should be construed as legal, tax, investment, financial, medical, or other professional advice. In addition, no part of this site—including articles or product references—constitutes a solicitation, recommendation, endorsement, advertisement, or offer to buy or sell any securities, franchises, or other financial instruments, particularly in jurisdictions where such activity would be unlawful.
All content is of a general nature and may not address the specific circumstances of any individual or entity. It is not a substitute for professional advice or services. Any actions you take based on the information provided here are strictly at your own risk. You accept full responsibility for any decisions or outcomes arising from your use of this website and agree to release us from any liability in connection with your use of, or reliance upon, the content or products found herein.