
|
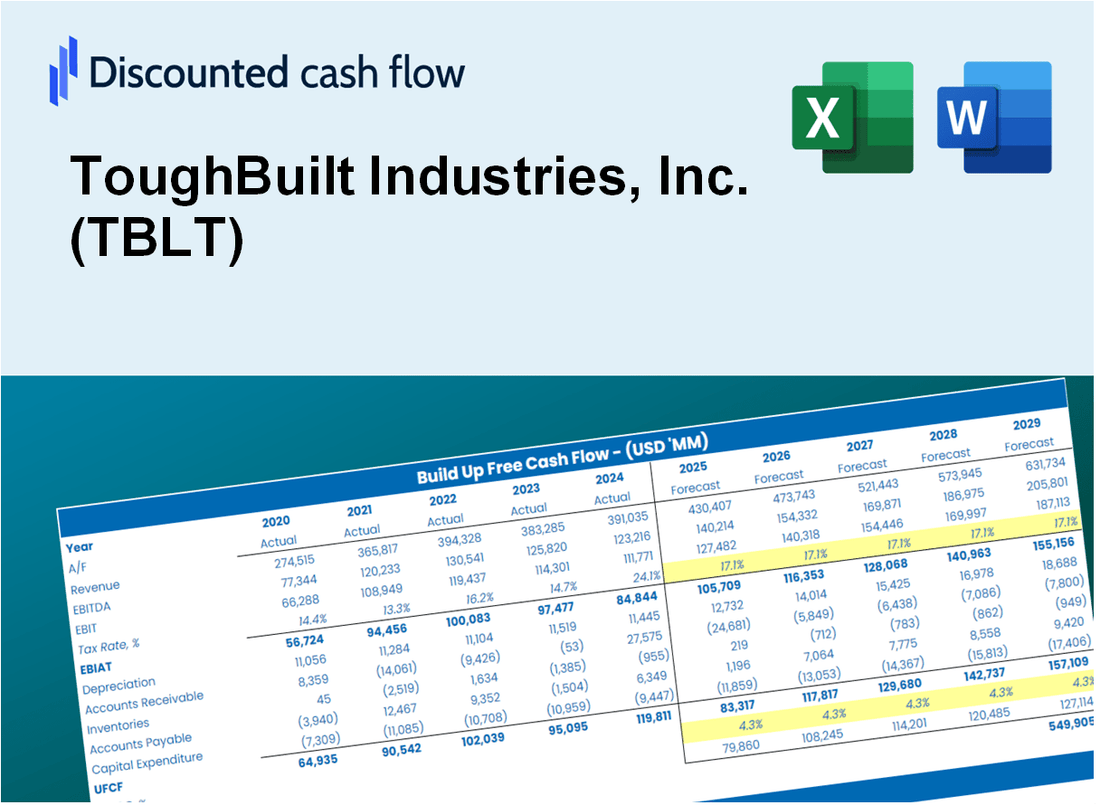
Avaliação DCF da ToughBuilt Industries, Inc. (TBLT) |
Totalmente Editável: Adapte-Se Às Suas Necessidades No Excel Ou Planilhas
Design Profissional: Modelos Confiáveis E Padrão Da Indústria
Pré-Construídos Para Uso Rápido E Eficiente
Compatível com MAC/PC, totalmente desbloqueado
Não É Necessária Experiência; Fácil De Seguir
ToughBuilt Industries, Inc. (TBLT) Bundle
Atualize sua análise e melhore a precisão com a nossa calculadora DCF (TBLT)! Utilizando dados de indústrias reais e resistentes e suposições personalizáveis, essa ferramenta o capacita a prever, avaliar e avaliar (TBLT) como um investidor especialista.
Discounted Cash Flow (DCF) - (USD MM)
| Year | AY1 2019 |
AY2 2020 |
AY3 2021 |
AY4 2022 |
AY5 2023 |
FY1 2024 |
FY2 2025 |
FY3 2026 |
FY4 2027 |
FY5 2028 |
|---|---|---|---|---|---|---|---|---|---|---|
| Revenue | 19.1 | 39.4 | 70.0 | 95.3 | 76.3 | 113.2 | 168.0 | 249.4 | 370.1 | 549.3 |
| Revenue Growth, % | 0 | 106.57 | 77.58 | 36.03 | -19.93 | 48.42 | 48.42 | 48.42 | 48.42 | 48.42 |
| EBITDA | -3.1 | -15.6 | -35.4 | -32.5 | -37.6 | -42.9 | -63.7 | -94.6 | -140.4 | -208.4 |
| EBITDA, % | -16.26 | -39.49 | -50.54 | -34.12 | -49.25 | -37.93 | -37.93 | -37.93 | -37.93 | -37.93 |
| Depreciation | .2 | .6 | 1.8 | 4.9 | 7.2 | 4.5 | 6.7 | 9.9 | 14.8 | 21.9 |
| Depreciation, % | 1.18 | 1.59 | 2.63 | 5.12 | 9.42 | 3.99 | 3.99 | 3.99 | 3.99 | 3.99 |
| EBIT | -3.3 | -16.2 | -37.2 | -37.4 | -44.7 | -47.5 | -70.4 | -104.5 | -155.1 | -230.3 |
| EBIT, % | -17.44 | -41.08 | -53.16 | -39.24 | -58.67 | -41.92 | -41.92 | -41.92 | -41.92 | -41.92 |
| Total Cash | .0 | 2.2 | 7.5 | 2.6 | 1.2 | 4.7 | 6.9 | 10.3 | 15.2 | 22.6 |
| Total Cash, percent | .0 | .0 | .0 | .0 | .0 | .0 | .0 | .0 | .0 | .0 |
| Account Receivables | 6.7 | 12.2 | 18.2 | 16.8 | 10.2 | 27.9 | 41.4 | 61.4 | 91.2 | 135.3 |
| Account Receivables, % | 35.25 | 30.89 | 25.96 | 17.65 | 13.43 | 24.64 | 24.64 | 24.64 | 24.64 | 24.64 |
| Inventories | 2.2 | 8.9 | 38.4 | 40.4 | 21.9 | 36.3 | 53.8 | 79.9 | 118.6 | 176.0 |
| Inventories, % | 11.61 | 22.61 | 54.88 | 42.38 | 28.77 | 32.05 | 32.05 | 32.05 | 32.05 | 32.05 |
| Accounts Payable | 2.5 | 7.0 | 14.4 | 29.7 | 47.0 | 32.7 | 48.5 | 71.9 | 106.8 | 158.5 |
| Accounts Payable, % | 13.29 | 17.64 | 20.62 | 31.15 | 61.56 | 28.85 | 28.85 | 28.85 | 28.85 | 28.85 |
| Capital Expenditure | -1.0 | -2.5 | -11.3 | -5.1 | -2.5 | -8.3 | -12.3 | -18.2 | -27.0 | -40.1 |
| Capital Expenditure, % | -5.4 | -6.33 | -16.14 | -5.35 | -3.3 | -7.31 | -7.31 | -7.31 | -7.31 | -7.31 |
| Tax Rate, % | 0 | 0 | 0 | 0 | 0 | 0 | 0 | 0 | 0 | 0 |
| EBITAT | -3.3 | -16.2 | -37.2 | -37.4 | -44.7 | -47.5 | -70.4 | -104.5 | -155.1 | -230.3 |
| Depreciation | ||||||||||
| Changes in Account Receivables | ||||||||||
| Changes in Inventories | ||||||||||
| Changes in Accounts Payable | ||||||||||
| Capital Expenditure | ||||||||||
| UFCF | -10.5 | -25.8 | -74.7 | -22.9 | 2.2 | -97.5 | -91.3 | -135.4 | -201.0 | -298.4 |
| WACC, % | 53.35 | 53.35 | 53.35 | 53.35 | 53.35 | 53.35 | 53.35 | 53.35 | 53.35 | 53.35 |
| PV UFCF | ||||||||||
| SUM PV UFCF | -211.5 | |||||||||
| Long Term Growth Rate, % | 2.00 | |||||||||
| Free cash flow (T + 1) | -304 | |||||||||
| Terminal Value | -593 | |||||||||
| Present Terminal Value | -70 | |||||||||
| Enterprise Value | -281 | |||||||||
| Net Debt | 2 | |||||||||
| Equity Value | -283 | |||||||||
| Diluted Shares Outstanding, MM | 0 | |||||||||
| Equity Value Per Share | -48,436.91 |
What You Will Receive
- Flexible Forecast Inputs: Easily modify key assumptions (growth %, margins, WACC) to create various scenarios.
- Comprehensive Industry Data: ToughBuilt’s financial metrics pre-filled to streamline your analysis.
- Automated DCF Calculations: The template computes Net Present Value (NPV) and intrinsic value for your convenience.
- Customizable and Professional Design: A sleek Excel model tailored to meet your valuation requirements.
- Designed for Analysts and Investors: Perfect for evaluating projections, validating strategies, and enhancing efficiency.
Key Features
- 🔍 Real-Life TBLT Financials: Pre-filled historical and projected financial data for ToughBuilt Industries, Inc.
- ✏️ Fully Customizable Inputs: Modify all essential parameters (yellow cells) including WACC, growth %, and tax rates.
- 📊 Professional DCF Valuation: Integrated formulas determine ToughBuilt's intrinsic value using the Discounted Cash Flow method.
- ⚡ Instant Results: Quickly visualize ToughBuilt's valuation as soon as adjustments are made.
- Scenario Analysis: Evaluate and contrast different financial assumptions side-by-side.
How It Works
- Step 1: Download the prebuilt Excel template featuring ToughBuilt Industries, Inc. (TBLT) data.
- Step 2: Navigate through the pre-filled sheets to grasp the key metrics.
- Step 3: Update forecasts and assumptions in the editable yellow cells (WACC, growth, margins).
- Step 4: Instantly view recalculated results, including ToughBuilt's intrinsic value.
- Step 5: Use the outputs to make informed investment decisions or generate reports.
Why Opt for This Calculator?
- All-in-One Solution: Features DCF, WACC, and financial ratio analyses tailored for ToughBuilt Industries, Inc. (TBLT).
- Flexible Customization: Modify the yellow-highlighted cells to explore different scenarios.
- In-Depth Analysis: Automatically calculates the intrinsic value and Net Present Value for ToughBuilt Industries, Inc. (TBLT).
- Integrated Data: Comes with historical and projected data for precise initial assessments.
- Expert-Level Quality: Perfect for financial analysts, investors, and business consultants working with ToughBuilt Industries, Inc. (TBLT).
Who Can Benefit from ToughBuilt Industries, Inc. (TBLT) Products?
- Construction Professionals: Enhance your project efficiency with our innovative and durable tools.
- Contractors: Streamline your workflow using our reliable solutions designed for heavy-duty tasks.
- DIY Enthusiasts: Tackle home improvement projects confidently with our user-friendly products.
- Retailers: Expand your inventory with our high-quality offerings that meet customer demand.
- Educators and Students: Utilize ToughBuilt tools as practical examples in vocational training programs.
Contents of the Template
- Pre-Filled DCF Model: ToughBuilt Industries, Inc.’s (TBLT) financial data preloaded for immediate use.
- WACC Calculator: Comprehensive calculations for Weighted Average Cost of Capital.
- Financial Ratios: Assess ToughBuilt’s profitability, leverage, and operational efficiency.
- Editable Inputs: Modify assumptions such as growth rates, profit margins, and capital expenditures to suit your scenarios.
- Financial Statements: Access annual and quarterly reports for thorough analysis.
- Interactive Dashboard: Visually represent key valuation metrics and outcomes with ease.
Disclaimer
All information, articles, and product details provided on this website are for general informational and educational purposes only. We do not claim any ownership over, nor do we intend to infringe upon, any trademarks, copyrights, logos, brand names, or other intellectual property mentioned or depicted on this site. Such intellectual property remains the property of its respective owners, and any references here are made solely for identification or informational purposes, without implying any affiliation, endorsement, or partnership.
We make no representations or warranties, express or implied, regarding the accuracy, completeness, or suitability of any content or products presented. Nothing on this website should be construed as legal, tax, investment, financial, medical, or other professional advice. In addition, no part of this site—including articles or product references—constitutes a solicitation, recommendation, endorsement, advertisement, or offer to buy or sell any securities, franchises, or other financial instruments, particularly in jurisdictions where such activity would be unlawful.
All content is of a general nature and may not address the specific circumstances of any individual or entity. It is not a substitute for professional advice or services. Any actions you take based on the information provided here are strictly at your own risk. You accept full responsibility for any decisions or outcomes arising from your use of this website and agree to release us from any liability in connection with your use of, or reliance upon, the content or products found herein.