
|
Tetragon Financial Group Limited (TFG.AS) DCF Avaliação |
Totalmente Editável: Adapte-Se Às Suas Necessidades No Excel Ou Planilhas
Design Profissional: Modelos Confiáveis E Padrão Da Indústria
Pré-Construídos Para Uso Rápido E Eficiente
Compatível com MAC/PC, totalmente desbloqueado
Não É Necessária Experiência; Fácil De Seguir
Tetragon Financial Group Limited (TFG.AS) Bundle
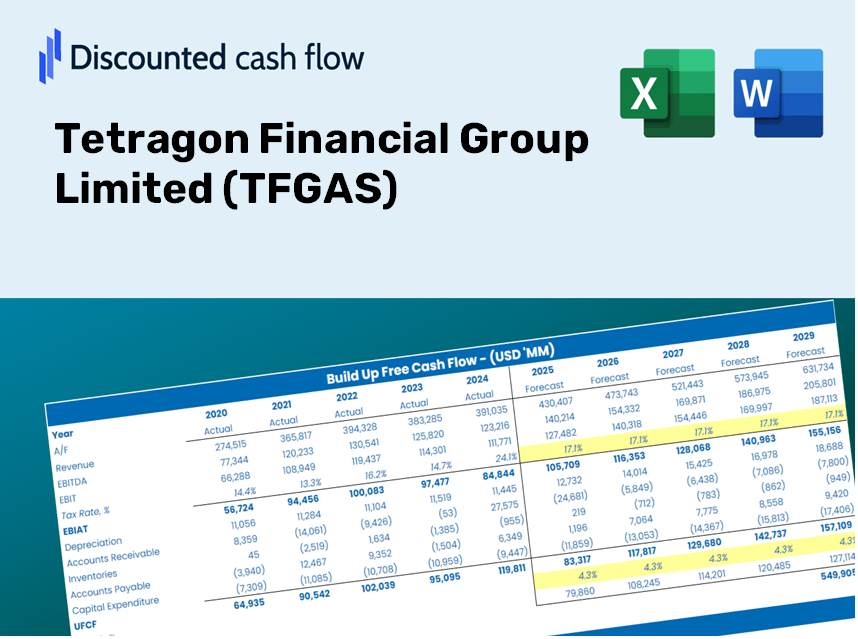
Explore o potencial financeiro do Tetragon Financial Group Limited (TFGAs) com nossa calculadora DCF fácil de usar! Digite suas projeções de crescimento, margens e despesas para descobrir o valor intrínseco do Tetragon e refinar sua abordagem de investimento.
Discounted Cash Flow (DCF) - (USD MM)
| Year | AY1 2020 |
AY2 2021 |
AY3 2022 |
AY4 2023 |
AY5 2024 |
FY1 2025 |
FY2 2026 |
FY3 2027 |
FY4 2028 |
FY5 2029 |
|---|---|---|---|---|---|---|---|---|---|---|
| Revenue | 306.4 | 611.0 | 61.7 | 240.4 | 520.7 | 793.4 | 1,209.0 | 1,842.3 | 2,807.2 | 4,277.5 |
| Revenue Growth, % | 0 | 99.41 | -89.9 | 289.63 | 116.6 | 52.38 | 52.38 | 52.38 | 52.38 | 52.38 |
| EBITDA | .0 | .0 | .0 | .0 | 377.3 | 115.0 | 175.2 | 267.0 | 406.8 | 619.9 |
| EBITDA, % | 0 | 0 | 0 | 0 | 72.46 | 14.49 | 14.49 | 14.49 | 14.49 | 14.49 |
| Depreciation | -177.3 | -425.4 | 23.0 | -164.8 | .0 | -251.9 | -383.9 | -585.0 | -891.4 | -1,358.2 |
| Depreciation, % | -57.87 | -69.62 | 37.28 | -68.55 | 0 | -31.75 | -31.75 | -31.75 | -31.75 | -31.75 |
| EBIT | 177.3 | 425.4 | -23.0 | 164.8 | 377.3 | 366.9 | 559.1 | 852.0 | 1,298.2 | 1,978.1 |
| EBIT, % | 57.87 | 69.62 | -37.28 | 68.55 | 72.46 | 46.24 | 46.24 | 46.24 | 46.24 | 46.24 |
| Total Cash | 191.6 | 198.8 | 21.7 | 23.1 | 30.5 | 231.2 | 352.3 | 536.9 | 818.1 | 1,246.5 |
| Total Cash, percent | .0 | .0 | .0 | .0 | .0 | .0 | .0 | .0 | .0 | .0 |
| Account Receivables | 44.8 | 6.3 | 7.6 | 7.6 | 8.4 | 52.0 | 79.2 | 120.6 | 183.8 | 280.1 |
| Account Receivables, % | 14.62 | 1.03 | 12.32 | 3.16 | 1.61 | 6.55 | 6.55 | 6.55 | 6.55 | 6.55 |
| Inventories | .0 | -12.7 | -33.3 | .0 | .0 | -88.9 | -135.5 | -206.5 | -314.7 | -479.5 |
| Inventories, % | 0 | -2.08 | -53.97 | 0 | 0 | -11.21 | -11.21 | -11.21 | -11.21 | -11.21 |
| Accounts Payable | .0 | .0 | .0 | .0 | .0 | .0 | .0 | .0 | .0 | .0 |
| Accounts Payable, % | 0 | 0 | 0 | 0 | 0 | 0 | 0 | 0 | 0 | 0 |
| Capital Expenditure | .0 | .0 | .0 | .0 | .0 | .0 | .0 | .0 | .0 | .0 |
| Capital Expenditure, % | 0 | 0 | 0 | 0 | 0 | 0 | 0 | 0 | 0 | 0 |
| Tax Rate, % | 0 | 0 | 0 | 0 | 0 | 0 | 0 | 0 | 0 | 0 |
| EBITAT | 177.3 | 425.4 | -23.0 | 164.8 | 377.3 | 366.9 | 559.1 | 852.0 | 1,298.2 | 1,978.1 |
| Depreciation | ||||||||||
| Changes in Account Receivables | ||||||||||
| Changes in Inventories | ||||||||||
| Changes in Accounts Payable | ||||||||||
| Capital Expenditure | ||||||||||
| UFCF | -44.8 | 51.2 | 19.3 | -33.3 | 376.5 | 160.4 | 194.6 | 296.5 | 451.8 | 688.4 |
| WACC, % | 5.25 | 5.25 | 5.25 | 5.25 | 5.25 | 5.25 | 5.25 | 5.25 | 5.25 | 5.25 |
| PV UFCF | ||||||||||
| SUM PV UFCF | 1,483.4 | |||||||||
| Long Term Growth Rate, % | 2.00 | |||||||||
| Free cash flow (T + 1) | 702 | |||||||||
| Terminal Value | 21,594 | |||||||||
| Present Terminal Value | 16,718 | |||||||||
| Enterprise Value | 18,202 | |||||||||
| Net Debt | 270 | |||||||||
| Equity Value | 17,932 | |||||||||
| Diluted Shares Outstanding, MM | 89 | |||||||||
| Equity Value Per Share | 200.58 |
What You Will Receive
- Authentic TFGAS Financial Data: Pre-filled with Tetragon Financial Group Limited’s historical and projected figures for accurate analysis.
- Completely Customizable Template: Easily adjust key inputs such as revenue growth, WACC, and EBITDA %.
- Instant Calculations: Watch Tetragon’s intrinsic value update in real-time as you modify inputs.
- Expert Valuation Tool: Crafted for investors, analysts, and consultants in need of reliable DCF results.
- User-Friendly Interface: Straightforward layout and clear guidance suitable for all skill levels.
Key Features
- Pre-Loaded Data: Tetragon Financial Group Limited’s historical financial statements and pre-filled forecasts.
- Fully Adjustable Inputs: Modify WACC, tax rates, revenue growth, and EBITDA margins to suit your analysis.
- Instant Results: View Tetragon’s intrinsic value recalculating in real-time.
- Clear Visual Outputs: Dashboard charts illustrate valuation results and essential metrics.
- Built for Accuracy: A professional-grade tool tailored for analysts, investors, and finance specialists.
How It Works
- Step 1: Download the ready-to-use Excel template featuring Tetragon Financial Group Limited’s (TFGAS) data.
- Step 2: Review the populated sheets to familiarize yourself with the essential metrics.
- Step 3: Modify the forecasts and assumptions in the editable yellow cells (WACC, growth, margins).
- Step 4: Instantly see the updated results, including Tetragon Financial Group Limited’s (TFGAS) intrinsic value.
- Step 5: Use the outputs to make informed investment decisions or create reports.
Why Choose This Calculator for Tetragon Financial Group Limited (TFGAS)?
- Designed for Experts: A sophisticated tool utilized by financial analysts, CFOs, and consultants.
- Comprehensive Data: Tetragon's historical and projected financials are preloaded for precise analysis.
- Flexible Scenario Analysis: Effortlessly simulate various forecasts and assumptions.
- Intuitive Outputs: Automatically computes intrinsic value, NPV, and essential metrics.
- User-Friendly: Step-by-step guidance takes you through the calculation process seamlessly.
Who Can Benefit from This Product?
- Investors: Accurately assess Tetragon Financial Group Limited’s ([TFGAS]) fair value prior to making investment choices.
- CFOs: Utilize a professional-grade DCF model for enhanced financial reporting and analysis.
- Consultants: Easily customize the template for valuation reports tailored to clients.
- Entrepreneurs: Discover financial modeling techniques employed by leading firms.
- Educators: Implement it as a teaching resource to illustrate valuation methodologies.
Contents of the Template
- Comprehensive DCF Model: An editable template featuring in-depth valuation calculations.
- Real-World Data: Tetragon Financial Group Limited’s (TFGAS) historical and projected financials preloaded for in-depth analysis.
- Customizable Parameters: Adjust WACC, growth rates, and tax assumptions to explore different scenarios.
- Financial Statements: Detailed annual and quarterly breakdowns for enhanced insights.
- Key Ratios: Integrated analysis for profitability, efficiency, and leverage metrics.
- Dashboard with Visual Outputs: Charts and tables that provide clear, actionable insights.
Disclaimer
All information, articles, and product details provided on this website are for general informational and educational purposes only. We do not claim any ownership over, nor do we intend to infringe upon, any trademarks, copyrights, logos, brand names, or other intellectual property mentioned or depicted on this site. Such intellectual property remains the property of its respective owners, and any references here are made solely for identification or informational purposes, without implying any affiliation, endorsement, or partnership.
We make no representations or warranties, express or implied, regarding the accuracy, completeness, or suitability of any content or products presented. Nothing on this website should be construed as legal, tax, investment, financial, medical, or other professional advice. In addition, no part of this site—including articles or product references—constitutes a solicitation, recommendation, endorsement, advertisement, or offer to buy or sell any securities, franchises, or other financial instruments, particularly in jurisdictions where such activity would be unlawful.
All content is of a general nature and may not address the specific circumstances of any individual or entity. It is not a substitute for professional advice or services. Any actions you take based on the information provided here are strictly at your own risk. You accept full responsibility for any decisions or outcomes arising from your use of this website and agree to release us from any liability in connection with your use of, or reliance upon, the content or products found herein.