
|
Teleflex Incorporated (TFX) Avaliação DCF |
Totalmente Editável: Adapte-Se Às Suas Necessidades No Excel Ou Planilhas
Design Profissional: Modelos Confiáveis E Padrão Da Indústria
Pré-Construídos Para Uso Rápido E Eficiente
Compatível com MAC/PC, totalmente desbloqueado
Não É Necessária Experiência; Fácil De Seguir
Teleflex Incorporated (TFX) Bundle
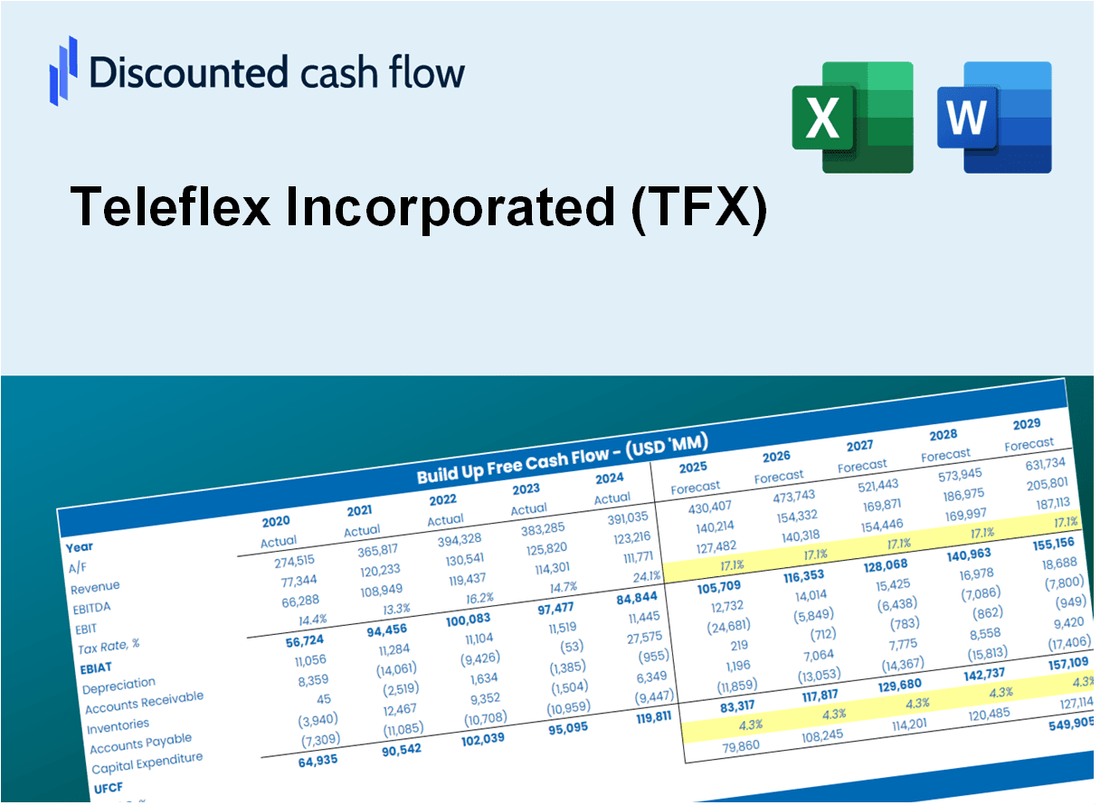
Explore o futuro financeiro do Explore Teleflex Incorporated (TFX) com nossa calculadora DCF! Digite suas projeções de crescimento, margens e despesas para calcular o valor intrínseco da Teleflex Incorporated (TFX) e refinar sua abordagem de investimento.
What You Will Get
- Editable Forecast Inputs: Easily modify assumptions (growth %, margins, WACC) to explore various scenarios.
- Real-World Data: Teleflex Incorporated’s (TFX) financial data pre-filled to kickstart your analysis.
- Automatic DCF Outputs: The template computes Net Present Value (NPV) and intrinsic value for you.
- Customizable and Professional: A sleek Excel model that adjusts to your valuation requirements.
- Built for Analysts and Investors: Perfect for testing projections, validating strategies, and enhancing efficiency.
Key Features
- Comprehensive Financial Data: Gain access to precise historical records and future forecasts for Teleflex Incorporated (TFX).
- Adjustable Forecast Parameters: Modify highlighted fields such as WACC, growth rates, and profit margins.
- Real-Time Calculations: Automatic recalculations for DCF, Net Present Value (NPV), and cash flow assessments.
- Interactive Dashboard: User-friendly charts and summaries to help you interpret your valuation findings.
- Designed for All Users: An intuitive layout tailored for investors, CFOs, and consultants alike.
How It Works
- Download the Template: Gain immediate access to the Excel-based TFX DCF Calculator.
- Input Your Assumptions: Modify the yellow-highlighted cells for growth rates, WACC, margins, and other variables.
- Instant Calculations: The model automatically recalculates Teleflex’s intrinsic value.
- Test Scenarios: Experiment with various assumptions to analyze potential valuation shifts.
- Analyze and Decide: Utilize the findings to inform your investment or financial assessment.
Why Choose This Calculator for Teleflex Incorporated (TFX)?
- User-Friendly Interface: Perfect for both novices and seasoned professionals.
- Customizable Inputs: Adjust variables effortlessly to suit your financial analysis.
- Real-Time Valuation: Monitor immediate updates to Teleflex’s valuation as you tweak the inputs.
- Pre-Loaded Data: Comes with Teleflex’s actual financial information for swift evaluations.
- Widely Endorsed: A go-to tool for investors and analysts aiming for informed strategies.
Who Should Use This Product?
- Investors: Evaluate Teleflex Incorporated’s (TFX) valuation before making investment decisions.
- CFOs and Financial Analysts: Enhance valuation methodologies and assess financial forecasts for Teleflex Incorporated (TFX).
- Startup Founders: Discover how established companies like Teleflex Incorporated (TFX) are valued in the market.
- Consultants: Provide comprehensive valuation analyses and reports for clients interested in Teleflex Incorporated (TFX).
- Students and Educators: Utilize Teleflex Incorporated’s (TFX) data to practice and instruct on valuation strategies.
What the Template Contains
- Preloaded TFX Data: Historical and projected financial data, including revenue, EBIT, and capital expenditures.
- DCF and WACC Models: Professional-grade sheets for calculating intrinsic value and Weighted Average Cost of Capital.
- Editable Inputs: Yellow-highlighted cells for adjusting revenue growth, tax rates, and discount rates.
- Financial Statements: Comprehensive annual and quarterly financials for deeper analysis.
- Key Ratios: Profitability, leverage, and efficiency ratios to evaluate performance.
- Dashboard and Charts: Visual summaries of valuation outcomes and assumptions.
Disclaimer
All information, articles, and product details provided on this website are for general informational and educational purposes only. We do not claim any ownership over, nor do we intend to infringe upon, any trademarks, copyrights, logos, brand names, or other intellectual property mentioned or depicted on this site. Such intellectual property remains the property of its respective owners, and any references here are made solely for identification or informational purposes, without implying any affiliation, endorsement, or partnership.
We make no representations or warranties, express or implied, regarding the accuracy, completeness, or suitability of any content or products presented. Nothing on this website should be construed as legal, tax, investment, financial, medical, or other professional advice. In addition, no part of this site—including articles or product references—constitutes a solicitation, recommendation, endorsement, advertisement, or offer to buy or sell any securities, franchises, or other financial instruments, particularly in jurisdictions where such activity would be unlawful.
All content is of a general nature and may not address the specific circumstances of any individual or entity. It is not a substitute for professional advice or services. Any actions you take based on the information provided here are strictly at your own risk. You accept full responsibility for any decisions or outcomes arising from your use of this website and agree to release us from any liability in connection with your use of, or reliance upon, the content or products found herein.