
|
Ti Systems Fluid Systems plc (TIFS.L) Avaliação DCF |
Totalmente Editável: Adapte-Se Às Suas Necessidades No Excel Ou Planilhas
Design Profissional: Modelos Confiáveis E Padrão Da Indústria
Pré-Construídos Para Uso Rápido E Eficiente
Compatível com MAC/PC, totalmente desbloqueado
Não É Necessária Experiência; Fácil De Seguir
TI Fluid Systems plc (TIFS.L) Bundle
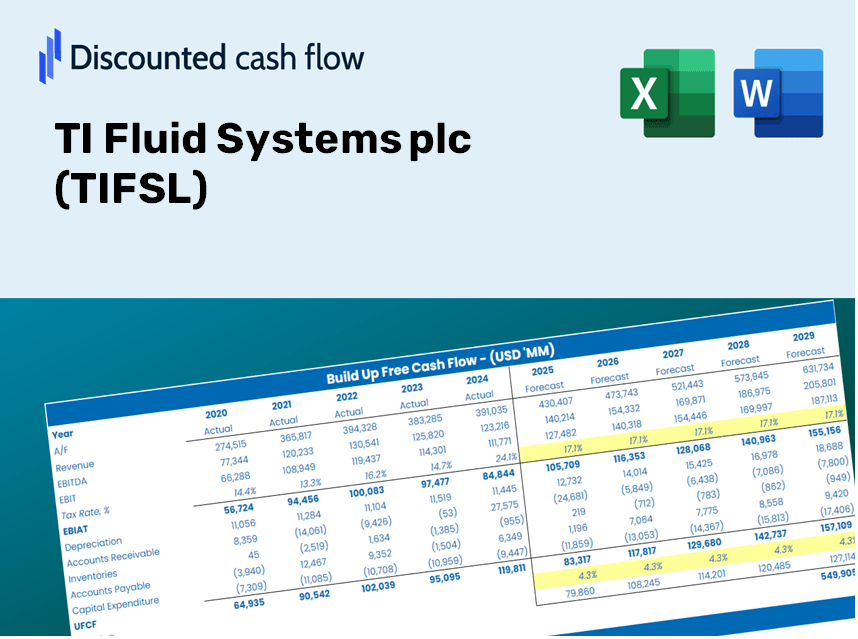
Simplifique seu processo e melhore a precisão com a nossa calculadora DCF (TIFSL)! Utilizando dados reais dos sistemas de fluido Ti PLC e suposições personalizáveis, essa ferramenta o capacita a prever, analisar e avaliar (TIFSL), assim como um investidor experiente.
Discounted Cash Flow (DCF) - (USD MM)
| Year | AY1 2020 |
AY2 2021 |
AY3 2022 |
AY4 2023 |
AY5 2024 |
FY1 2025 |
FY2 2026 |
FY3 2027 |
FY4 2028 |
FY5 2029 |
|---|---|---|---|---|---|---|---|---|---|---|
| Revenue | 2,451.3 | 2,575.1 | 2,846.5 | 3,062.4 | 2,926.7 | 3,063.8 | 3,207.3 | 3,357.6 | 3,515.0 | 3,679.7 |
| Revenue Growth, % | 0 | 5.05 | 10.54 | 7.58 | -4.43 | 4.69 | 4.69 | 4.69 | 4.69 | 4.69 |
| EBITDA | 19.0 | 269.3 | -4.6 | 243.3 | 247.4 | 168.3 | 176.2 | 184.5 | 193.1 | 202.1 |
| EBITDA, % | 0.77456 | 10.46 | -0.16216 | 7.95 | 8.45 | 5.49 | 5.49 | 5.49 | 5.49 | 5.49 |
| Depreciation | 185.7 | 167.2 | 179.6 | 74.9 | 98.3 | 160.4 | 168.0 | 175.8 | 184.1 | 192.7 |
| Depreciation, % | 7.58 | 6.49 | 6.31 | 2.45 | 3.36 | 5.24 | 5.24 | 5.24 | 5.24 | 5.24 |
| EBIT | -166.7 | 102.1 | -184.2 | 168.4 | 149.0 | 7.9 | 8.2 | 8.6 | 9.0 | 9.5 |
| EBIT, % | -6.8 | 3.96 | -6.47 | 5.5 | 5.09 | 0.25686 | 0.25686 | 0.25686 | 0.25686 | 0.25686 |
| Total Cash | 423.9 | 435.5 | 427.6 | 362.9 | 350.0 | 447.5 | 468.5 | 490.5 | 513.5 | 537.5 |
| Total Cash, percent | .0 | .0 | .0 | .0 | .0 | .0 | .0 | .0 | .0 | .0 |
| Account Receivables | 465.8 | 453.3 | 472.0 | 480.1 | 490.6 | 524.7 | 549.3 | 575.0 | 601.9 | 630.2 |
| Account Receivables, % | 19 | 17.6 | 16.58 | 15.68 | 16.76 | 17.13 | 17.13 | 17.13 | 17.13 | 17.13 |
| Inventories | 306.1 | 289.4 | 324.0 | 329.6 | 350.1 | 354.4 | 371.0 | 388.4 | 406.6 | 425.6 |
| Inventories, % | 12.49 | 11.24 | 11.38 | 10.76 | 11.96 | 11.57 | 11.57 | 11.57 | 11.57 | 11.57 |
| Accounts Payable | 534.9 | 475.6 | 509.3 | 551.2 | 542.5 | 580.4 | 607.6 | 636.1 | 665.9 | 697.1 |
| Accounts Payable, % | 21.82 | 18.47 | 17.89 | 18 | 18.54 | 18.94 | 18.94 | 18.94 | 18.94 | 18.94 |
| Capital Expenditure | -97.7 | -66.0 | -102.7 | -91.8 | -105.1 | -102.6 | -107.4 | -112.5 | -117.7 | -123.2 |
| Capital Expenditure, % | -3.99 | -2.56 | -3.61 | -3 | -3.59 | -3.35 | -3.35 | -3.35 | -3.35 | -3.35 |
| Tax Rate, % | 49.45 | 49.45 | 49.45 | 49.45 | 49.45 | 49.45 | 49.45 | 49.45 | 49.45 | 49.45 |
| EBITAT | -165.6 | 27.0 | -186.4 | 116.1 | 75.3 | 5.4 | 5.7 | 6.0 | 6.2 | 6.5 |
| Depreciation | ||||||||||
| Changes in Account Receivables | ||||||||||
| Changes in Inventories | ||||||||||
| Changes in Accounts Payable | ||||||||||
| Capital Expenditure | ||||||||||
| UFCF | -314.7 | 98.0 | -129.0 | 127.5 | 28.7 | 62.8 | 52.2 | 54.7 | 57.2 | 59.9 |
| WACC, % | 6.22 | 4.69 | 6.23 | 5.58 | 5.2 | 5.58 | 5.58 | 5.58 | 5.58 | 5.58 |
| PV UFCF | ||||||||||
| SUM PV UFCF | 244.5 | |||||||||
| Long Term Growth Rate, % | 2.00 | |||||||||
| Free cash flow (T + 1) | 61 | |||||||||
| Terminal Value | 1,705 | |||||||||
| Present Terminal Value | 1,299 | |||||||||
| Enterprise Value | 1,544 | |||||||||
| Net Debt | 682 | |||||||||
| Equity Value | 861 | |||||||||
| Diluted Shares Outstanding, MM | 508 | |||||||||
| Equity Value Per Share | 169.45 |
What You Will Receive
- Customizable Excel Template: A tailored Excel-based DCF Calculator featuring pre-filled financial data for TI Fluid Systems plc (TIFSL).
- Accurate Data: Comprehensive historical data and forward-looking projections (highlighted in the yellow cells).
- Flexible Forecasting: Adjust key assumptions such as revenue growth, EBITDA %, and WACC.
- Instant Calculations: Quickly assess how your changes affect the valuation of TI Fluid Systems plc (TIFSL).
- Professional Resource: Designed for investors, CFOs, consultants, and financial analysts.
- User-Friendly Layout: Organized for clarity and ease of navigation, complete with step-by-step guidance.
Key Features
- Accurate TI Fluid Systems Financials: Gain access to reliable historical data and forward-looking projections tailored for TI Fluid Systems plc (TIFSL).
- Adjustable Forecast Parameters: Modify highlighted fields, including WACC, growth rates, and margins, to suit your analysis.
- Real-Time Calculations: Enjoy automatic updates for DCF, Net Present Value (NPV), and cash flow evaluations.
- User-Friendly Dashboard: View straightforward charts and summaries that clearly depict your valuation findings.
- Suitable for All Experience Levels: Designed with simplicity and intuitiveness in mind, making it ideal for investors, CFOs, and consultants alike.
How It Works
- Download: Obtain the pre-prepared Excel file featuring TI Fluid Systems plc’s (TIFSL) financial data.
- Customize: Modify projections, including revenue growth, EBITDA %, and WACC.
- Update Automatically: The intrinsic value and NPV calculations refresh in real time.
- Test Scenarios: Generate various forecasts and instantly compare results.
- Make Decisions: Leverage the valuation findings to inform your investment strategies.
Why Opt for This Calculator?
- User-Friendly Interface: Tailored for both novices and seasoned professionals.
- Customizable Inputs: Adjust parameters easily to suit your analysis needs.
- Real-Time Updates: Witness immediate changes to TI Fluid Systems plc’s ([TIFSL]) valuation as you modify the inputs.
- Pre-Loaded Data: Comes ready with TI Fluid Systems plc’s ([TIFSL]) actual financial figures for swift evaluations.
- Relied Upon by Experts: Endorsed by investors and analysts for informed decision-making.
Who Should Use This Product?
- Institutional Investors: Develop comprehensive and accurate valuation models for analyzing investments in TI Fluid Systems plc (TIFSL).
- Corporate Finance Departments: Evaluate valuation scenarios to inform strategic decision-making within the organization.
- Consultants and Financial Advisors: Deliver precise valuation insights to clients interested in TI Fluid Systems plc (TIFSL).
- Academics and Learners: Utilize real-world data to enhance skills in financial modeling and education.
- Automotive Industry Enthusiasts: Gain insights into how companies like TI Fluid Systems plc (TIFSL) are valued in the marketplace.
Contents of the Template
- Preloaded TIFSL Data: Historical and forecasted financial information, including revenue, EBIT, and capital expenditures.
- DCF and WACC Models: Professional-grade sheets designed for calculating intrinsic value and Weighted Average Cost of Capital.
- Editable Inputs: Cells highlighted in yellow for adjusting revenue growth, tax rates, and discount rates.
- Financial Statements: Extensive annual and quarterly financial data for in-depth analysis.
- Key Ratios: Profitability, leverage, and efficiency ratios to assess performance.
- Dashboard and Charts: Visual representations of valuation results and underlying assumptions.
Disclaimer
All information, articles, and product details provided on this website are for general informational and educational purposes only. We do not claim any ownership over, nor do we intend to infringe upon, any trademarks, copyrights, logos, brand names, or other intellectual property mentioned or depicted on this site. Such intellectual property remains the property of its respective owners, and any references here are made solely for identification or informational purposes, without implying any affiliation, endorsement, or partnership.
We make no representations or warranties, express or implied, regarding the accuracy, completeness, or suitability of any content or products presented. Nothing on this website should be construed as legal, tax, investment, financial, medical, or other professional advice. In addition, no part of this site—including articles or product references—constitutes a solicitation, recommendation, endorsement, advertisement, or offer to buy or sell any securities, franchises, or other financial instruments, particularly in jurisdictions where such activity would be unlawful.
All content is of a general nature and may not address the specific circumstances of any individual or entity. It is not a substitute for professional advice or services. Any actions you take based on the information provided here are strictly at your own risk. You accept full responsibility for any decisions or outcomes arising from your use of this website and agree to release us from any liability in connection with your use of, or reliance upon, the content or products found herein.