
|
Avaliação DCF da Tennant Company (TNC) |
Totalmente Editável: Adapte-Se Às Suas Necessidades No Excel Ou Planilhas
Design Profissional: Modelos Confiáveis E Padrão Da Indústria
Pré-Construídos Para Uso Rápido E Eficiente
Compatível com MAC/PC, totalmente desbloqueado
Não É Necessária Experiência; Fácil De Seguir
Tennant Company (TNC) Bundle
Aprimore suas opções de investimento usando a calculadora DCF da Tennant Company (TNC)! Explore dados financeiros reais, ajuste as previsões e despesas do crescimento e observe instantaneamente como essas mudanças afetam o valor intrínseco da Tennant Company (TNC).
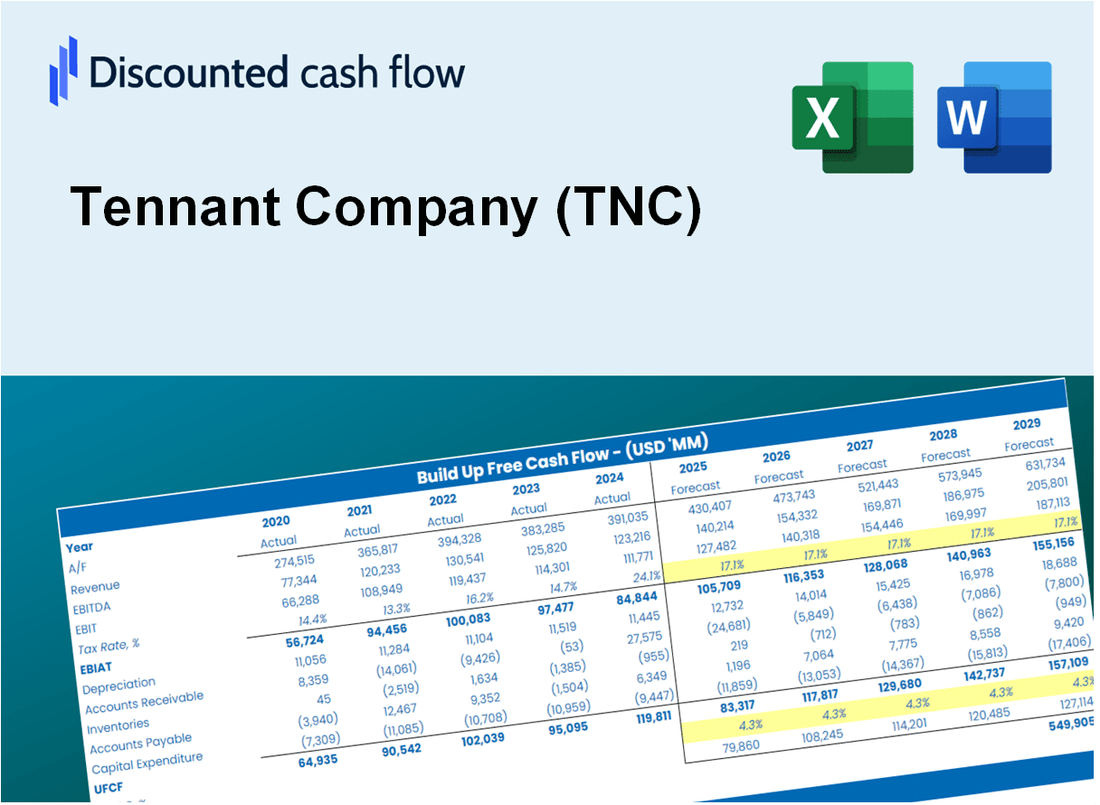
Discounted Cash Flow (DCF) - (USD MM)
| Year | AY1 2020 |
AY2 2021 |
AY3 2022 |
AY4 2023 |
AY5 2024 |
FY1 2025 |
FY2 2026 |
FY3 2027 |
FY4 2028 |
FY5 2029 |
|---|---|---|---|---|---|---|---|---|---|---|
| Revenue | 1,001.0 | 1,090.8 | 1,092.2 | 1,243.6 | 1,286.7 | 1,371.7 | 1,462.3 | 1,558.9 | 1,661.9 | 1,771.7 |
| Revenue Growth, % | 0 | 8.97 | 0.12835 | 13.86 | 3.47 | 6.61 | 6.61 | 6.61 | 6.61 | 6.61 |
| EBITDA | 117.1 | 137.0 | 136.3 | 188.4 | 175.2 | 179.7 | 191.6 | 204.2 | 217.7 | 232.1 |
| EBITDA, % | 11.7 | 12.56 | 12.48 | 15.15 | 13.62 | 13.1 | 13.1 | 13.1 | 13.1 | 13.1 |
| Depreciation | 53.4 | 53.1 | 48.7 | 51.1 | 55.1 | 63.2 | 67.4 | 71.9 | 76.6 | 81.7 |
| Depreciation, % | 5.33 | 4.87 | 4.46 | 4.11 | 4.28 | 4.61 | 4.61 | 4.61 | 4.61 | 4.61 |
| EBIT | 63.7 | 83.9 | 87.6 | 137.3 | 120.1 | 116.5 | 124.2 | 132.4 | 141.1 | 150.4 |
| EBIT, % | 6.36 | 7.69 | 8.02 | 11.04 | 9.33 | 8.49 | 8.49 | 8.49 | 8.49 | 8.49 |
| Total Cash | 141.0 | 123.6 | 77.4 | 117.1 | 99.6 | 136.2 | 145.2 | 154.8 | 165.1 | 176.0 |
| Total Cash, percent | .0 | .0 | .0 | .0 | .0 | .0 | .0 | .0 | .0 | .0 |
| Account Receivables | 199.9 | 211.4 | 251.5 | 247.6 | 259.1 | 281.0 | 299.6 | 319.3 | 340.4 | 362.9 |
| Account Receivables, % | 19.97 | 19.38 | 23.03 | 19.91 | 20.14 | 20.48 | 20.48 | 20.48 | 20.48 | 20.48 |
| Inventories | 127.7 | 160.6 | 206.6 | 175.9 | 183.8 | 205.3 | 218.8 | 233.3 | 248.7 | 265.1 |
| Inventories, % | 12.76 | 14.72 | 18.92 | 14.14 | 14.28 | 14.97 | 14.97 | 14.97 | 14.97 | 14.97 |
| Accounts Payable | 106.3 | 121.5 | 126.1 | 111.4 | 126.9 | 143.0 | 152.4 | 162.5 | 173.3 | 184.7 |
| Accounts Payable, % | 10.62 | 11.14 | 11.55 | 8.96 | 9.86 | 10.42 | 10.42 | 10.42 | 10.42 | 10.42 |
| Capital Expenditure | -30.0 | -23.2 | -29.3 | -24.0 | -21.4 | -31.3 | -33.3 | -35.5 | -37.9 | -40.4 |
| Capital Expenditure, % | -3 | -2.13 | -2.68 | -1.93 | -1.66 | -2.28 | -2.28 | -2.28 | -2.28 | -2.28 |
| Tax Rate, % | 20.13 | 20.13 | 20.13 | 20.13 | 20.13 | 20.13 | 20.13 | 20.13 | 20.13 | 20.13 |
| EBITAT | 52.2 | 73.5 | 73.1 | 121.4 | 95.9 | 98.1 | 104.6 | 111.5 | 118.9 | 126.7 |
| Depreciation | ||||||||||
| Changes in Account Receivables | ||||||||||
| Changes in Inventories | ||||||||||
| Changes in Accounts Payable | ||||||||||
| Capital Expenditure | ||||||||||
| UFCF | -145.7 | 74.2 | 11.0 | 168.4 | 125.7 | 102.8 | 116.0 | 123.7 | 131.8 | 140.6 |
| WACC, % | 7.88 | 7.91 | 7.89 | 7.92 | 7.87 | 7.9 | 7.9 | 7.9 | 7.9 | 7.9 |
| PV UFCF | ||||||||||
| SUM PV UFCF | 486.8 | |||||||||
| Long Term Growth Rate, % | 3.00 | |||||||||
| Free cash flow (T + 1) | 145 | |||||||||
| Terminal Value | 2,957 | |||||||||
| Present Terminal Value | 2,022 | |||||||||
| Enterprise Value | 2,509 | |||||||||
| Net Debt | 155 | |||||||||
| Equity Value | 2,355 | |||||||||
| Diluted Shares Outstanding, MM | 19 | |||||||||
| Equity Value Per Share | 123.30 |
What You Will Get
- Real TNC Financial Data: Pre-filled with Tennant Company’s historical and projected data for precise analysis.
- Fully Editable Template: Modify key inputs like revenue growth, WACC, and EBITDA % with ease.
- Automatic Calculations: See Tennant Company’s intrinsic value update instantly based on your changes.
- Professional Valuation Tool: Designed for investors, analysts, and consultants seeking accurate DCF results.
- User-Friendly Design: Simple structure and clear instructions for all experience levels.
Key Features
- Comprehensive DCF Calculator: Features both unlevered and levered DCF valuation models tailored for Tennant Company (TNC).
- WACC Calculator: Pre-configured Weighted Average Cost of Capital sheet with adjustable parameters.
- Customizable Forecast Assumptions: Alter growth rates, capital expenditures, and discount rates as needed.
- Integrated Financial Ratios: Evaluate profitability, leverage, and efficiency ratios specific to Tennant Company (TNC).
- Interactive Dashboard and Charts: Visual representations highlight essential valuation metrics for streamlined analysis.
How It Works
- 1. Access the Template: Download and open the Excel file containing Tennant Company's (TNC) preloaded data.
- 2. Adjust Key Inputs: Modify essential parameters such as growth rates, WACC, and capital expenditures.
- 3. Instant Results: The DCF model automatically computes intrinsic value and NPV in real-time.
- 4. Explore Scenarios: Analyze various forecasts to evaluate different valuation scenarios.
- 5. Present with Assurance: Deliver professional valuation insights to reinforce your strategic decisions.
Why Choose This Calculator for Tennant Company (TNC)?
- Accuracy: Utilizes real Tennant Company financials to ensure precise data.
- Flexibility: Built to allow users to easily test and adjust inputs as needed.
- Time-Saving: Eliminate the complexity of creating a DCF model from the ground up.
- Professional-Grade: Crafted with the precision and usability expected by CFOs.
- User-Friendly: Intuitive design makes it accessible for users without extensive financial modeling skills.
Who Should Use This Product?
- Individual Investors: Make informed decisions about buying or selling Tennant Company (TNC) stock.
- Financial Analysts: Streamline valuation processes with ready-to-use financial models for Tennant Company (TNC).
- Consultants: Deliver professional valuation insights on Tennant Company (TNC) to clients quickly and accurately.
- Business Owners: Understand how companies like Tennant Company (TNC) are valued to guide your own strategy.
- Finance Students: Learn valuation techniques using real-world data and scenarios based on Tennant Company (TNC).
What the Template Contains
- Pre-Filled DCF Model: Tennant Company’s (TNC) financial data preloaded for immediate use.
- WACC Calculator: Detailed calculations for Weighted Average Cost of Capital.
- Financial Ratios: Evaluate Tennant Company’s (TNC) profitability, leverage, and efficiency.
- Editable Inputs: Change assumptions such as growth, margins, and CAPEX to fit your scenarios.
- Financial Statements: Annual and quarterly reports to support detailed analysis.
- Interactive Dashboard: Easily visualize key valuation metrics and results.
Disclaimer
All information, articles, and product details provided on this website are for general informational and educational purposes only. We do not claim any ownership over, nor do we intend to infringe upon, any trademarks, copyrights, logos, brand names, or other intellectual property mentioned or depicted on this site. Such intellectual property remains the property of its respective owners, and any references here are made solely for identification or informational purposes, without implying any affiliation, endorsement, or partnership.
We make no representations or warranties, express or implied, regarding the accuracy, completeness, or suitability of any content or products presented. Nothing on this website should be construed as legal, tax, investment, financial, medical, or other professional advice. In addition, no part of this site—including articles or product references—constitutes a solicitation, recommendation, endorsement, advertisement, or offer to buy or sell any securities, franchises, or other financial instruments, particularly in jurisdictions where such activity would be unlawful.
All content is of a general nature and may not address the specific circumstances of any individual or entity. It is not a substitute for professional advice or services. Any actions you take based on the information provided here are strictly at your own risk. You accept full responsibility for any decisions or outcomes arising from your use of this website and agree to release us from any liability in connection with your use of, or reliance upon, the content or products found herein.