
|
Avaliação DCF do Texas Pacific Land Corporation (TPL) |
Totalmente Editável: Adapte-Se Às Suas Necessidades No Excel Ou Planilhas
Design Profissional: Modelos Confiáveis E Padrão Da Indústria
Pré-Construídos Para Uso Rápido E Eficiente
Compatível com MAC/PC, totalmente desbloqueado
Não É Necessária Experiência; Fácil De Seguir
Texas Pacific Land Corporation (TPL) Bundle
Explore o potencial financeiro da Texas Pacific Land Corporation (TPL) com nossa calculadora DCF amigável! Digite suas projeções de crescimento, margens e despesas para determinar o valor intrínseco da Texas Pacific Land Corporation (TPL) e aprimorar sua abordagem de investimento.
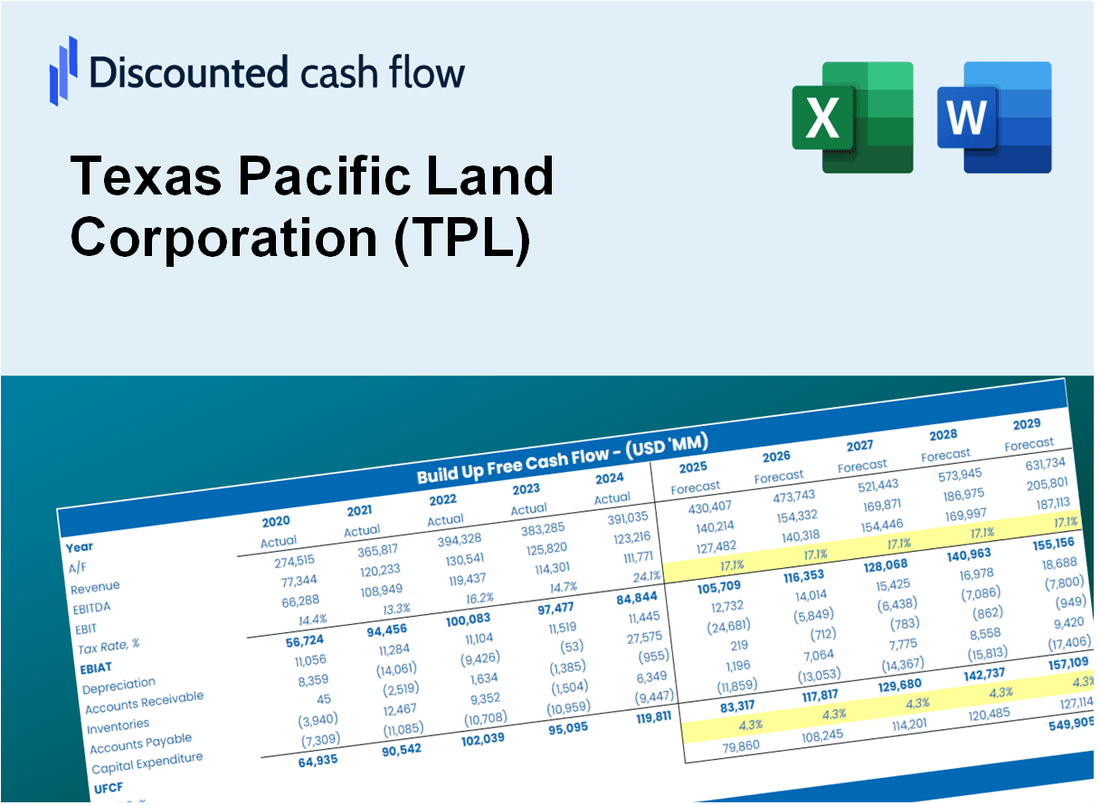
Discounted Cash Flow (DCF) - (USD MM)
| Year | AY1 2020 |
AY2 2021 |
AY3 2022 |
AY4 2023 |
AY5 2024 |
FY1 2025 |
FY2 2026 |
FY3 2027 |
FY4 2028 |
FY5 2029 |
|---|---|---|---|---|---|---|---|---|---|---|
| Revenue | 302.6 | 451.0 | 667.4 | 631.6 | 705.8 | 888.3 | 1,118.1 | 1,407.2 | 1,771.1 | 2,229.0 |
| Revenue Growth, % | 0 | 49.05 | 48 | -5.37 | 11.75 | 25.86 | 25.86 | 25.86 | 25.86 | 25.86 |
| EBITDA | 231.7 | 378.7 | 577.7 | 500.8 | 564.3 | 721.9 | 908.6 | 1,143.6 | 1,439.3 | 1,811.4 |
| EBITDA, % | 76.57 | 83.97 | 86.55 | 79.29 | 79.95 | 81.27 | 81.27 | 81.27 | 81.27 | 81.27 |
| Depreciation | 14.4 | 16.3 | 15.4 | 14.8 | 25.2 | 29.4 | 37.0 | 46.6 | 58.7 | 73.9 |
| Depreciation, % | 4.76 | 3.6 | 2.3 | 2.34 | 3.56 | 3.31 | 3.31 | 3.31 | 3.31 | 3.31 |
| EBIT | 217.3 | 362.4 | 562.3 | 486.1 | 539.1 | 692.5 | 871.6 | 1,096.9 | 1,380.6 | 1,737.6 |
| EBIT, % | 71.81 | 80.36 | 84.25 | 76.96 | 76.38 | 77.95 | 77.95 | 77.95 | 77.95 | 77.95 |
| Total Cash | 281.0 | 428.2 | 510.8 | 725.2 | 369.8 | 740.5 | 932.0 | 1,173.0 | 1,476.3 | 1,858.1 |
| Total Cash, percent | .0 | .0 | .0 | .0 | .0 | .0 | .0 | .0 | .0 | .0 |
| Account Receivables | 48.2 | 95.2 | 104.0 | 129.0 | 126.7 | 161.7 | 203.5 | 256.1 | 322.3 | 405.7 |
| Account Receivables, % | 15.94 | 21.11 | 15.58 | 20.42 | 17.95 | 18.2 | 18.2 | 18.2 | 18.2 | 18.2 |
| Inventories | 108.5 | 109.1 | 109.7 | .0 | .0 | 135.9 | 171.1 | 215.3 | 271.0 | 341.0 |
| Inventories, % | 35.87 | 24.19 | 16.44 | 0 | 0 | 15.3 | 15.3 | 15.3 | 15.3 | 15.3 |
| Accounts Payable | 13.3 | 17.9 | 23.4 | 22.5 | 27.0 | 34.2 | 43.1 | 54.2 | 68.3 | 85.9 |
| Accounts Payable, % | 4.4 | 3.97 | 3.51 | 3.56 | 3.82 | 3.85 | 3.85 | 3.85 | 3.85 | 3.85 |
| Capital Expenditure | -5.1 | -15.5 | -19.2 | -15.0 | -29.7 | -25.9 | -32.6 | -41.1 | -51.7 | -65.1 |
| Capital Expenditure, % | -1.68 | -3.45 | -2.88 | -2.38 | -4.21 | -2.92 | -2.92 | -2.92 | -2.92 | -2.92 |
| Tax Rate, % | 21.57 | 21.57 | 21.57 | 21.57 | 21.57 | 21.57 | 21.57 | 21.57 | 21.57 | 21.57 |
| EBITAT | 174.1 | 269.5 | 441.2 | 381.0 | 422.8 | 539.8 | 679.4 | 855.1 | 1,076.3 | 1,354.6 |
| Depreciation | ||||||||||
| Changes in Account Receivables | ||||||||||
| Changes in Inventories | ||||||||||
| Changes in Accounts Payable | ||||||||||
| Capital Expenditure | ||||||||||
| UFCF | 40.0 | 227.3 | 433.5 | 464.5 | 425.1 | 379.7 | 615.8 | 775.0 | 975.4 | 1,227.6 |
| WACC, % | 9.05 | 9.05 | 9.05 | 9.05 | 9.05 | 9.05 | 9.05 | 9.05 | 9.05 | 9.05 |
| PV UFCF | ||||||||||
| SUM PV UFCF | 2,949.1 | |||||||||
| Long Term Growth Rate, % | 3.50 | |||||||||
| Free cash flow (T + 1) | 1,271 | |||||||||
| Terminal Value | 22,881 | |||||||||
| Present Terminal Value | 14,835 | |||||||||
| Enterprise Value | 17,784 | |||||||||
| Net Debt | -369 | |||||||||
| Equity Value | 18,154 | |||||||||
| Diluted Shares Outstanding, MM | 23 | |||||||||
| Equity Value Per Share | 788.61 |
What You Will Get
- Real TPL Financial Data: Pre-filled with Texas Pacific Land Corporation’s historical and projected data for precise analysis.
- Fully Editable Template: Modify key inputs like revenue growth, WACC, and EBITDA % with ease.
- Automatic Calculations: See TPL’s intrinsic value update instantly based on your changes.
- Professional Valuation Tool: Designed for investors, analysts, and consultants seeking accurate DCF results.
- User-Friendly Design: Simple structure and clear instructions for all experience levels.
Key Features
- Comprehensive Historical Data: Texas Pacific Land Corporation's (TPL) past financial statements and detailed forecasts.
- Customizable Assumptions: Modify WACC, tax rates, revenue growth projections, and EBITDA margins.
- Real-Time Valuation: Instantly view the intrinsic value of Texas Pacific Land Corporation (TPL) as it updates dynamically.
- Intuitive Visualizations: Interactive dashboard charts present valuation outcomes and critical metrics clearly.
- Designed for Precision: A robust tool tailored for analysts, investors, and finance professionals.
How It Works
- Download: Get the pre-built Excel file featuring Texas Pacific Land Corporation's (TPL) financial metrics.
- Customize: Tailor your forecasts, including revenue growth, EBITDA %, and WACC as per your analysis.
- Update Automatically: Watch as the intrinsic value and NPV calculations refresh in real-time.
- Test Scenarios: Develop various projections and instantly compare different outcomes.
- Make Decisions: Leverage the valuation results to inform your investment approach.
Why Choose This Calculator for Texas Pacific Land Corporation (TPL)?
- Accurate Data: Utilize real financials from Texas Pacific Land Corporation for dependable valuation outcomes.
- Customizable: Tailor essential parameters such as growth rates, WACC, and tax rates to align with your forecasts.
- Time-Saving: Pre-configured calculations save you the hassle of building from the ground up.
- Professional-Grade Tool: Crafted for investors, analysts, and consultants in the field.
- User-Friendly: Streamlined design and clear instructions ensure accessibility for all users.
Who Should Use This Product?
- Investors: Accurately assess Texas Pacific Land Corporation’s (TPL) fair value prior to making investment choices.
- CFOs: Utilize a professional-grade DCF model for comprehensive financial reporting and analysis for Texas Pacific Land Corporation (TPL).
- Consultants: Efficiently customize the template for valuation reports tailored to clients interested in Texas Pacific Land Corporation (TPL).
- Entrepreneurs: Acquire knowledge about financial modeling practices employed by leading companies like Texas Pacific Land Corporation (TPL).
- Educators: Employ it as a teaching resource to illustrate various valuation methodologies related to Texas Pacific Land Corporation (TPL).
What the Template Contains
- Pre-Filled DCF Model: Texas Pacific Land Corporation’s (TPL) financial data preloaded for immediate use.
- WACC Calculator: Detailed calculations for Weighted Average Cost of Capital.
- Financial Ratios: Evaluate Texas Pacific Land Corporation’s (TPL) profitability, leverage, and efficiency.
- Editable Inputs: Change assumptions such as growth, margins, and CAPEX to fit your scenarios.
- Financial Statements: Annual and quarterly reports to support detailed analysis.
- Interactive Dashboard: Easily visualize key valuation metrics and results.
Disclaimer
All information, articles, and product details provided on this website are for general informational and educational purposes only. We do not claim any ownership over, nor do we intend to infringe upon, any trademarks, copyrights, logos, brand names, or other intellectual property mentioned or depicted on this site. Such intellectual property remains the property of its respective owners, and any references here are made solely for identification or informational purposes, without implying any affiliation, endorsement, or partnership.
We make no representations or warranties, express or implied, regarding the accuracy, completeness, or suitability of any content or products presented. Nothing on this website should be construed as legal, tax, investment, financial, medical, or other professional advice. In addition, no part of this site—including articles or product references—constitutes a solicitation, recommendation, endorsement, advertisement, or offer to buy or sell any securities, franchises, or other financial instruments, particularly in jurisdictions where such activity would be unlawful.
All content is of a general nature and may not address the specific circumstances of any individual or entity. It is not a substitute for professional advice or services. Any actions you take based on the information provided here are strictly at your own risk. You accept full responsibility for any decisions or outcomes arising from your use of this website and agree to release us from any liability in connection with your use of, or reliance upon, the content or products found herein.