
|
TriplePoint Venture Growth BDC Corp. (TPVG) Avaliação DCF |
Totalmente Editável: Adapte-Se Às Suas Necessidades No Excel Ou Planilhas
Design Profissional: Modelos Confiáveis E Padrão Da Indústria
Pré-Construídos Para Uso Rápido E Eficiente
Compatível com MAC/PC, totalmente desbloqueado
Não É Necessária Experiência; Fácil De Seguir
TriplePoint Venture Growth BDC Corp. (TPVG) Bundle
Descubra o verdadeiro potencial do TriplePoint Venture Growth BDC Corp. (TPVG) com nossa calculadora DCF avançada! Ajuste as principais suposições, explore vários cenários e avalie os efeitos de diferentes variáveis na avaliação do TriplePoint - tudo dentro de um único modelo do Excel.
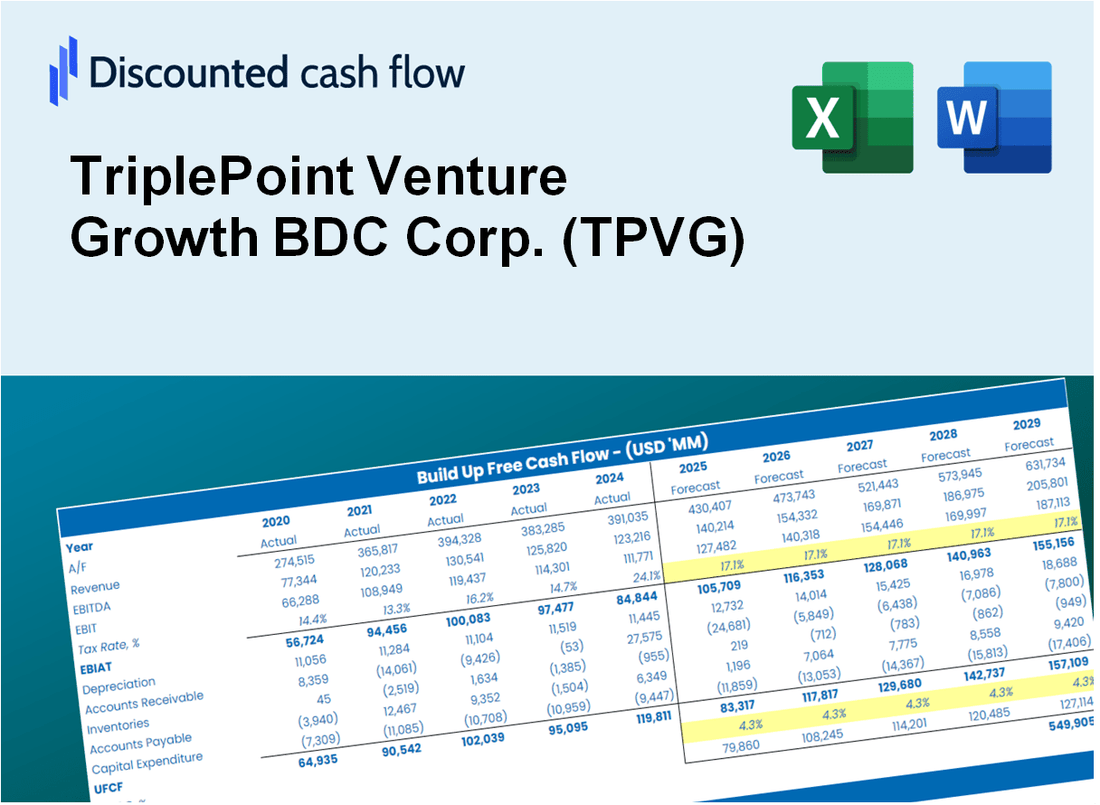
Discounted Cash Flow (DCF) - (USD MM)
| Year | AY1 2020 |
AY2 2021 |
AY3 2022 |
AY4 2023 |
AY5 2024 |
FY1 2025 |
FY2 2026 |
FY3 2027 |
FY4 2028 |
FY5 2029 |
|---|---|---|---|---|---|---|---|---|---|---|
| Revenue | 57.5 | 100.7 | 13.4 | 6.0 | 71.2 | 77.1 | 83.4 | 90.3 | 97.8 | 105.9 |
| Revenue Growth, % | 0 | 75.21 | -86.7 | -55.43 | 1092.41 | 8.27 | 8.27 | 8.27 | 8.27 | 8.27 |
| EBITDA | 35.3 | 76.6 | -20.1 | -39.8 | 32.0 | -2.7 | -2.9 | -3.2 | -3.4 | -3.7 |
| EBITDA, % | 61.41 | 76 | -149.83 | -667.02 | 45.02 | -3.52 | -3.52 | -3.52 | -3.52 | -3.52 |
| Depreciation | .0 | .0 | .0 | .0 | .0 | .0 | .0 | .0 | .0 | .0 |
| Depreciation, % | 0 | 0 | 0 | 0 | 0 | 0 | 0 | 0 | 0 | 0 |
| EBIT | 35.3 | 76.6 | -20.1 | -39.8 | 32.0 | -2.7 | -2.9 | -3.2 | -3.4 | -3.7 |
| EBIT, % | 61.41 | 76 | -149.83 | -667.02 | 45.02 | -3.52 | -3.52 | -3.52 | -3.52 | -3.52 |
| Total Cash | 38.2 | 51.3 | 51.5 | 153.3 | 45.9 | 58.9 | 63.7 | 69.0 | 74.7 | 80.9 |
| Total Cash, percent | .0 | .0 | .0 | .0 | .0 | .0 | .0 | .0 | .0 | .0 |
| Account Receivables | .0 | .0 | .0 | .0 | .0 | .0 | .0 | .0 | .0 | .0 |
| Account Receivables, % | 0 | 0 | 0 | 0 | 0 | 0 | 0 | 0 | 0 | 0 |
| Inventories | .0 | .0 | .0 | .0 | .0 | .0 | .0 | .0 | .0 | .0 |
| Inventories, % | 0 | 0 | 0 | 0 | 0 | 0 | 0 | 0 | 0 | 0 |
| Accounts Payable | 3.1 | .0 | .0 | .0 | .0 | .8 | .9 | 1.0 | 1.1 | 1.1 |
| Accounts Payable, % | 5.37 | 0 | 0 | 0 | 0 | 1.07 | 1.07 | 1.07 | 1.07 | 1.07 |
| Capital Expenditure | .0 | .0 | .0 | .0 | .0 | .0 | .0 | .0 | .0 | .0 |
| Capital Expenditure, % | 0 | 0 | 0 | 0 | 0 | 0 | 0 | 0 | 0 | 0 |
| Tax Rate, % | 0 | 0 | 0 | 0 | 0 | 0 | 0 | 0 | 0 | 0 |
| EBITAT | 35.3 | 76.6 | -20.1 | -39.8 | 32.0 | -2.7 | -2.9 | -3.2 | -3.4 | -3.7 |
| Depreciation | ||||||||||
| Changes in Account Receivables | ||||||||||
| Changes in Inventories | ||||||||||
| Changes in Accounts Payable | ||||||||||
| Capital Expenditure | ||||||||||
| UFCF | 38.4 | 73.5 | -20.1 | -39.8 | 32.0 | -1.9 | -2.9 | -3.1 | -3.4 | -3.6 |
| WACC, % | 7.89 | 7.89 | 7.89 | 7.89 | 7.89 | 7.89 | 7.89 | 7.89 | 7.89 | 7.89 |
| PV UFCF | ||||||||||
| SUM PV UFCF | -11.6 | |||||||||
| Long Term Growth Rate, % | 2.00 | |||||||||
| Free cash flow (T + 1) | -4 | |||||||||
| Terminal Value | -63 | |||||||||
| Present Terminal Value | -43 | |||||||||
| Enterprise Value | -55 | |||||||||
| Net Debt | 353 | |||||||||
| Equity Value | -408 | |||||||||
| Diluted Shares Outstanding, MM | 39 | |||||||||
| Equity Value Per Share | -10.42 |
What You Will Get
- Real TPVG Data: Preloaded financials – from revenue to EBIT – based on actual and projected figures.
- Full Customization: Adjust all critical parameters (yellow cells) like WACC, growth %, and tax rates.
- Instant Valuation Updates: Automatic recalculations to analyze the impact of changes on TriplePoint Venture Growth BDC Corp.’s fair value.
- Versatile Excel Template: Tailored for quick edits, scenario testing, and detailed projections.
- Time-Saving and Accurate: Skip building models from scratch while maintaining precision and flexibility.
Key Features
- Real-Time TPVG Data: Pre-filled with TriplePoint Venture Growth BDC Corp.'s historical financials and future projections.
- Fully Customizable Inputs: Modify revenue growth, margins, WACC, tax rates, and capital expenditures to suit your analysis.
- Dynamic Valuation Model: Automatic recalculations of Net Present Value (NPV) and intrinsic value based on your provided inputs.
- Scenario Testing: Develop various forecast scenarios to evaluate different valuation results.
- User-Friendly Design: Intuitive, organized, and crafted for both professionals and novices.
How It Works
- Step 1: Download the Excel file for TriplePoint Venture Growth BDC Corp. (TPVG).
- Step 2: Review the pre-filled financial data and projections for TriplePoint.
- Step 3: Adjust key inputs such as revenue growth, WACC, and tax rates (highlighted cells).
- Step 4: Observe the DCF model update in real-time as you adjust your assumptions.
- Step 5: Evaluate the outputs and apply the findings to your investment strategies.
Why Choose This Calculator for TriplePoint Venture Growth BDC Corp. (TPVG)?
- User-Friendly Interface: Crafted for both novices and seasoned professionals.
- Customizable Inputs: Adjust parameters effortlessly to suit your financial analysis.
- Real-Time Feedback: Monitor immediate changes in TPVG’s valuation as you tweak inputs.
- Pre-Loaded Data: Comes equipped with TriplePoint’s latest financial metrics for swift evaluations.
- Relied Upon by Experts: Favored by investors and analysts for making strategic decisions.
Who Should Use This Product?
- Investors: Effectively assess the fair value of TriplePoint Venture Growth BDC Corp. (TPVG) prior to making investment choices.
- CFOs: Utilize a high-quality DCF model for comprehensive financial reporting and analysis.
- Consultants: Seamlessly customize the template for client valuation reports.
- Entrepreneurs: Discover financial modeling strategies employed by leading venture firms.
- Educators: Implement it as a resource to illustrate valuation techniques in the classroom.
What the Template Contains
- Comprehensive DCF Model: Editable template featuring detailed valuation calculations tailored for TriplePoint Venture Growth BDC Corp. (TPVG).
- Real-World Data: Historical and projected financials for TriplePoint Venture Growth BDC Corp. (TPVG) preloaded for in-depth analysis.
- Customizable Parameters: Adjust WACC, growth rates, and tax assumptions to explore various scenarios for TriplePoint Venture Growth BDC Corp. (TPVG).
- Financial Statements: Complete annual and quarterly breakdowns for enhanced insights into TriplePoint Venture Growth BDC Corp. (TPVG).
- Key Ratios: Integrated analysis for profitability, efficiency, and leverage specific to TriplePoint Venture Growth BDC Corp. (TPVG).
- Dashboard with Visual Outputs: Charts and tables providing clear, actionable results for TriplePoint Venture Growth BDC Corp. (TPVG).
Disclaimer
All information, articles, and product details provided on this website are for general informational and educational purposes only. We do not claim any ownership over, nor do we intend to infringe upon, any trademarks, copyrights, logos, brand names, or other intellectual property mentioned or depicted on this site. Such intellectual property remains the property of its respective owners, and any references here are made solely for identification or informational purposes, without implying any affiliation, endorsement, or partnership.
We make no representations or warranties, express or implied, regarding the accuracy, completeness, or suitability of any content or products presented. Nothing on this website should be construed as legal, tax, investment, financial, medical, or other professional advice. In addition, no part of this site—including articles or product references—constitutes a solicitation, recommendation, endorsement, advertisement, or offer to buy or sell any securities, franchises, or other financial instruments, particularly in jurisdictions where such activity would be unlawful.
All content is of a general nature and may not address the specific circumstances of any individual or entity. It is not a substitute for professional advice or services. Any actions you take based on the information provided here are strictly at your own risk. You accept full responsibility for any decisions or outcomes arising from your use of this website and agree to release us from any liability in connection with your use of, or reliance upon, the content or products found herein.