
|
Avaliação DCF da Trinity Biotech Plc (TRIB) |
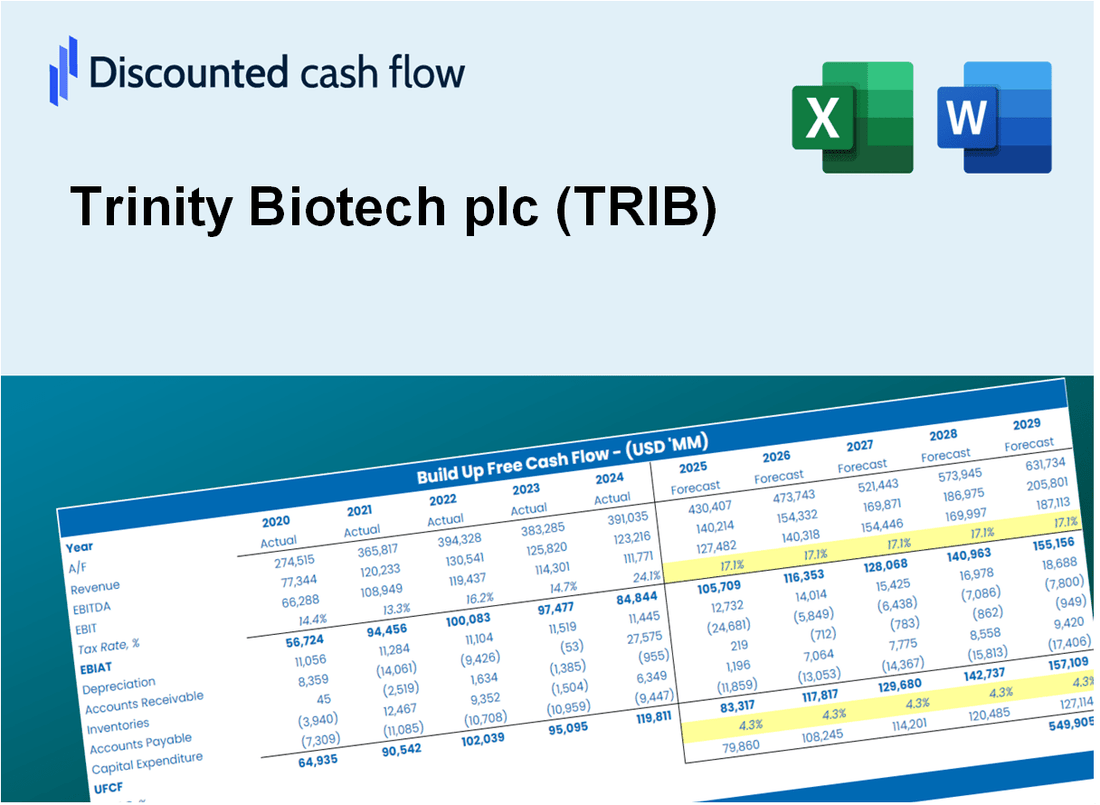
Totalmente Editável: Adapte-Se Às Suas Necessidades No Excel Ou Planilhas
Design Profissional: Modelos Confiáveis E Padrão Da Indústria
Pré-Construídos Para Uso Rápido E Eficiente
Compatível com MAC/PC, totalmente desbloqueado
Não É Necessária Experiência; Fácil De Seguir
Trinity Biotech plc (TRIB) Bundle
Projetado para precisão, nossa calculadora DCF (TRIB) permite avaliar a avaliação do Trinity Biotech PLC usando dados financeiros reais e fornece flexibilidade completa para modificar todos os parâmetros -chave para melhorar as projeções.
What You Will Receive
- Authentic Trinity Biotech Data: Comprehensive financials – from revenue to EBIT – based on real and forecasted figures.
- Complete Customization: Modify all essential parameters (yellow cells) such as WACC, growth %, and tax rates.
- Immediate Valuation Updates: Automatic recalculations to assess the effects of changes on Trinity Biotech’s fair value.
- Flexible Excel Template: Designed for quick modifications, scenario analysis, and in-depth projections.
- Efficient and Precise: Avoid starting models from the ground up while ensuring accuracy and adaptability.
Key Features
- Customizable Forecast Inputs: Adjust essential factors such as revenue projections, gross margins, and R&D expenses.
- Instant DCF Valuation: Quickly computes intrinsic value, net present value (NPV), and additional financial metrics.
- High-Precision Accuracy: Leverages Trinity Biotech's actual financial data for credible valuation results.
- Effortless Scenario Analysis: Evaluate various assumptions and analyze results with ease.
- Efficiency Booster: Avoid the complexity of constructing detailed valuation models from the ground up.
How It Works
- Step 1: Download the Excel file.
- Step 2: Review Trinity Biotech plc’s pre-filled financial data and forecasts.
- Step 3: Modify key inputs such as revenue growth, WACC, and tax rates (highlighted cells).
- Step 4: Observe the DCF model update in real-time as you adjust your assumptions.
- Step 5: Analyze the outputs and leverage the results for informed investment decisions regarding Trinity Biotech plc (TRIB).
Why Choose This Calculator?
- User-Friendly Interface: Tailored for both novices and seasoned professionals.
- Customizable Inputs: Adjust parameters effortlessly to suit your analysis needs.
- Real-Time Feedback: Observe immediate updates to Trinity Biotech's valuation as you modify inputs.
- Preloaded Data: Comes equipped with Trinity Biotech's actual financial information for swift evaluations.
- Relied Upon by Experts: Trusted by investors and analysts for making well-informed choices.
Who Should Use Trinity Biotech plc (TRIB)?
- Investors: Gain insights and make informed decisions with our advanced biotechnology analysis tools.
- Financial Analysts: Streamline your workflow with customizable financial models tailored to the biotech sector.
- Consultants: Easily modify our resources for effective client presentations and strategic reports.
- Biotech Enthusiasts: Enhance your knowledge of the industry through comprehensive case studies and real-world applications.
- Educators and Students: Utilize our materials as a hands-on resource in biotechnology and finance courses.
What the Template Contains
- Preloaded TRIB Data: Historical and projected financial data, including revenue, EBIT, and capital expenditures.
- DCF and WACC Models: Professional-grade sheets for calculating intrinsic value and Weighted Average Cost of Capital.
- Editable Inputs: Yellow-highlighted cells for adjusting revenue growth, tax rates, and discount rates.
- Financial Statements: Comprehensive annual and quarterly financials for deeper analysis.
- Key Ratios: Profitability, leverage, and efficiency ratios to evaluate performance.
- Dashboard and Charts: Visual summaries of valuation outcomes and assumptions.
Disclaimer
All information, articles, and product details provided on this website are for general informational and educational purposes only. We do not claim any ownership over, nor do we intend to infringe upon, any trademarks, copyrights, logos, brand names, or other intellectual property mentioned or depicted on this site. Such intellectual property remains the property of its respective owners, and any references here are made solely for identification or informational purposes, without implying any affiliation, endorsement, or partnership.
We make no representations or warranties, express or implied, regarding the accuracy, completeness, or suitability of any content or products presented. Nothing on this website should be construed as legal, tax, investment, financial, medical, or other professional advice. In addition, no part of this site—including articles or product references—constitutes a solicitation, recommendation, endorsement, advertisement, or offer to buy or sell any securities, franchises, or other financial instruments, particularly in jurisdictions where such activity would be unlawful.
All content is of a general nature and may not address the specific circumstances of any individual or entity. It is not a substitute for professional advice or services. Any actions you take based on the information provided here are strictly at your own risk. You accept full responsibility for any decisions or outcomes arising from your use of this website and agree to release us from any liability in connection with your use of, or reliance upon, the content or products found herein.