
|
Avaliação DCF da Trinity Capital Inc. (TRIN) |
Totalmente Editável: Adapte-Se Às Suas Necessidades No Excel Ou Planilhas
Design Profissional: Modelos Confiáveis E Padrão Da Indústria
Pré-Construídos Para Uso Rápido E Eficiente
Compatível com MAC/PC, totalmente desbloqueado
Não É Necessária Experiência; Fácil De Seguir
Trinity Capital Inc. (TRIN) Bundle
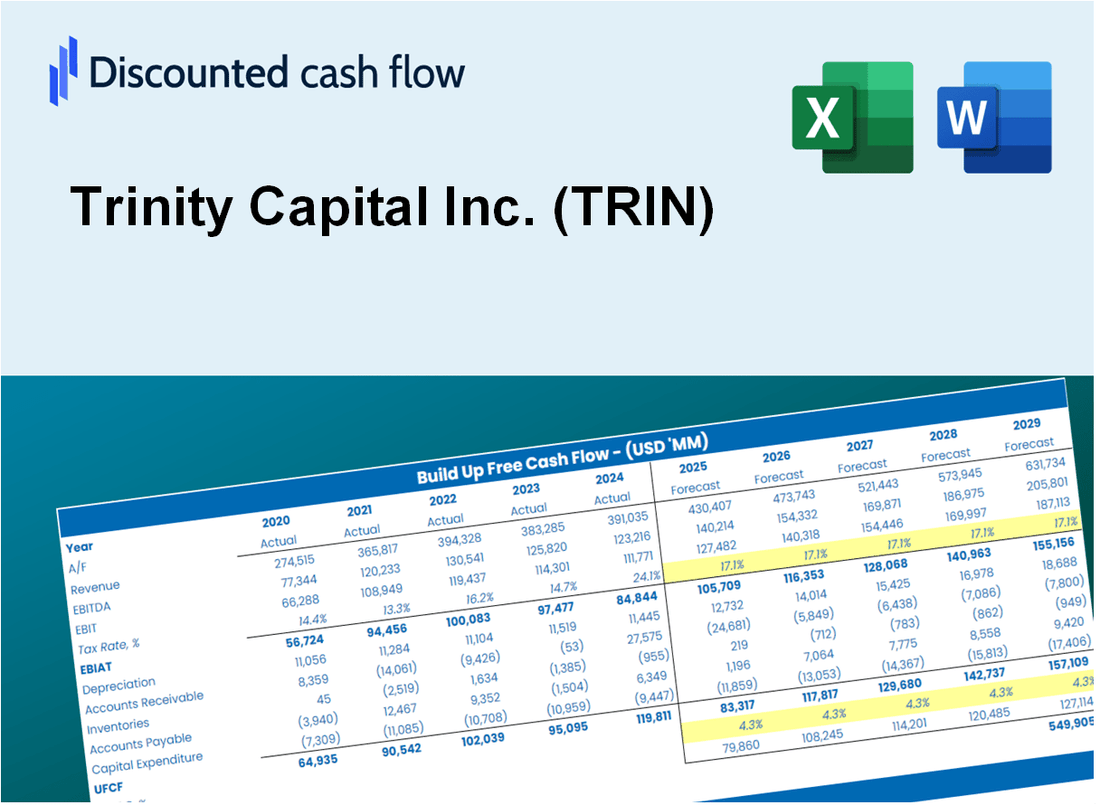
Simplifique a avaliação da Trinity Capital Inc. (TRIN) com esta calculadora DCF personalizável! Com o Real Trinity Capital Inc. (TRIN) Financeiras e insumos de previsão ajustáveis, você pode testar cenários e descobrir o valor justo da Trinity Capital Inc. (TRIN) em minutos.
Discounted Cash Flow (DCF) - (USD MM)
| Year | AY1 2020 |
AY2 2021 |
AY3 2022 |
AY4 2023 |
AY5 2024 |
FY1 2025 |
FY2 2026 |
FY3 2027 |
FY4 2028 |
FY5 2029 |
|---|---|---|---|---|---|---|---|---|---|---|
| Revenue | 23.8 | 155.1 | 9.4 | 174.8 | 226.7 | 303.7 | 406.7 | 544.7 | 729.6 | 977.1 |
| Revenue Growth, % | 0 | 551.02 | -93.94 | 1761.78 | 29.68 | 33.93 | 33.93 | 33.93 | 33.93 | 33.93 |
| EBITDA | .0 | .0 | 101.5 | 121.2 | 177.5 | 150.4 | 201.4 | 269.8 | 361.3 | 483.9 |
| EBITDA, % | 0 | 0 | 1080.39 | 69.31 | 78.31 | 49.52 | 49.52 | 49.52 | 49.52 | 49.52 |
| Depreciation | 19.8 | -57.8 | 174.6 | -8.6 | .0 | 85.6 | 114.6 | 153.5 | 205.6 | 275.3 |
| Depreciation, % | 83.06 | -37.28 | 1859.01 | -4.89 | 0 | 28.18 | 28.18 | 28.18 | 28.18 | 28.18 |
| EBIT | -19.8 | 57.8 | -73.1 | 129.7 | 177.5 | 4.1 | 5.5 | 7.3 | 9.8 | 13.2 |
| EBIT, % | -83.06 | 37.28 | -778.63 | 74.21 | 78.31 | 1.35 | 1.35 | 1.35 | 1.35 | 1.35 |
| Total Cash | 44.7 | 31.7 | 47.9 | 4.8 | 9.6 | 138.1 | 185.0 | 247.7 | 331.8 | 444.4 |
| Total Cash, percent | .0 | .0 | .0 | .0 | .0 | .0 | .0 | .0 | .0 | .0 |
| Account Receivables | 3.5 | 5.6 | 10.0 | 11.2 | 16.5 | 80.1 | 107.2 | 143.6 | 192.4 | 257.7 |
| Account Receivables, % | 14.56 | 3.58 | 106.18 | 6.41 | 7.3 | 26.37 | 26.37 | 26.37 | 26.37 | 26.37 |
| Inventories | 64.6 | 52.3 | 20.6 | .0 | .0 | 141.9 | 190.1 | 254.6 | 341.0 | 456.7 |
| Inventories, % | 271.05 | 33.72 | 219.18 | 0 | 0 | 46.74 | 46.74 | 46.74 | 46.74 | 46.74 |
| Accounts Payable | 13.3 | 24.4 | 41.1 | 19.4 | 31.5 | 119.4 | 160.0 | 214.3 | 287.0 | 384.3 |
| Accounts Payable, % | 55.99 | 15.73 | 437.62 | 11.07 | 13.87 | 39.33 | 39.33 | 39.33 | 39.33 | 39.33 |
| Capital Expenditure | -.3 | -1.2 | -.2 | -2.7 | -.4 | -3.4 | -4.6 | -6.2 | -8.3 | -11.1 |
| Capital Expenditure, % | -1.06 | -0.77634 | -2.07 | -1.57 | -0.18524 | -1.13 | -1.13 | -1.13 | -1.13 | -1.13 |
| Tax Rate, % | 2.47 | 2.47 | 2.47 | 2.47 | 2.47 | 2.47 | 2.47 | 2.47 | 2.47 | 2.47 |
| EBITAT | -19.8 | 57.8 | -79.4 | 125.6 | 173.2 | 4.0 | 5.4 | 7.3 | 9.7 | 13.0 |
| Depreciation | ||||||||||
| Changes in Account Receivables | ||||||||||
| Changes in Inventories | ||||||||||
| Changes in Accounts Payable | ||||||||||
| Capital Expenditure | ||||||||||
| UFCF | -55.0 | 20.0 | 139.0 | 111.9 | 179.5 | -31.3 | 80.6 | 108.0 | 144.6 | 193.7 |
| WACC, % | 6.82 | 6.82 | 6.82 | 6.7 | 6.73 | 6.78 | 6.78 | 6.78 | 6.78 | 6.78 |
| PV UFCF | ||||||||||
| SUM PV UFCF | 380.8 | |||||||||
| Long Term Growth Rate, % | 2.00 | |||||||||
| Free cash flow (T + 1) | 198 | |||||||||
| Terminal Value | 4,133 | |||||||||
| Present Terminal Value | 2,978 | |||||||||
| Enterprise Value | 3,358 | |||||||||
| Net Debt | 868 | |||||||||
| Equity Value | 2,490 | |||||||||
| Diluted Shares Outstanding, MM | 57 | |||||||||
| Equity Value Per Share | 43.90 |
What You Will Get
- Real TRIN Financial Data: Pre-filled with Trinity Capital Inc.'s historical and projected data for precise analysis.
- Fully Editable Template: Modify key inputs like revenue growth, WACC, and EBITDA % with ease.
- Automatic Calculations: See Trinity Capital Inc.'s intrinsic value update instantly based on your changes.
- Professional Valuation Tool: Designed for investors, analysts, and consultants seeking accurate DCF results.
- User-Friendly Design: Simple structure and clear instructions for all experience levels.
Key Features
- Comprehensive Data: Trinity Capital Inc.'s historical financial records and pre-filled projections.
- Customizable Variables: Adjust WACC, tax rates, revenue growth, and EBITDA margins to fit your analysis.
- Real-Time Insights: Monitor Trinity Capital Inc.'s intrinsic value as it updates instantly.
- Visual Performance Metrics: Interactive dashboard charts showcase valuation outcomes and essential metrics.
- Designed for Precision: A robust tool tailored for analysts, investors, and finance professionals.
How It Works
- Download: Access the ready-to-use Excel file with Trinity Capital Inc.’s (TRIN) financial data.
- Customize: Adjust forecasts, including revenue growth, EBITDA %, and WACC.
- Update Automatically: The intrinsic value and NPV calculations update in real-time.
- Test Scenarios: Create multiple projections and compare outcomes instantly.
- Make Decisions: Use the valuation results to guide your investment strategy.
Why Choose This Calculator for Trinity Capital Inc. (TRIN)?
- Accurate Data: Up-to-date financial information for Trinity Capital Inc. ensures dependable valuation outcomes.
- Customizable: Modify essential parameters such as growth rates, WACC, and tax rates to align with your forecasts.
- Time-Saving: Pre-configured calculations save you the hassle of starting from scratch.
- Professional-Grade Tool: Tailored for investors, analysts, and consultants focused on TRIN.
- User-Friendly: An intuitive design and clear instructions make it accessible for all users.
Who Should Use This Product?
- Finance Students: Explore investment strategies and apply them to real-world scenarios involving Trinity Capital Inc. (TRIN).
- Academics: Utilize advanced financial models in your teaching or research focused on Trinity Capital Inc. (TRIN).
- Investors: Evaluate your investment hypotheses and assess valuation metrics for Trinity Capital Inc. (TRIN).
- Analysts: Enhance your analysis with a tailored, user-friendly DCF model specific to Trinity Capital Inc. (TRIN).
- Small Business Owners: Understand the valuation approaches used for analyzing public companies like Trinity Capital Inc. (TRIN).
What the Template Contains
- Historical Data: Includes Trinity Capital Inc.’s (TRIN) past financials and baseline forecasts.
- DCF and Levered DCF Models: Detailed templates to calculate Trinity Capital Inc.’s (TRIN) intrinsic value.
- WACC Sheet: Pre-built calculations for Weighted Average Cost of Capital.
- Editable Inputs: Modify key drivers like growth rates, EBITDA %, and CAPEX assumptions.
- Quarterly and Annual Statements: A complete breakdown of Trinity Capital Inc.’s (TRIN) financials.
- Interactive Dashboard: Visualize valuation results and projections dynamically.
Disclaimer
All information, articles, and product details provided on this website are for general informational and educational purposes only. We do not claim any ownership over, nor do we intend to infringe upon, any trademarks, copyrights, logos, brand names, or other intellectual property mentioned or depicted on this site. Such intellectual property remains the property of its respective owners, and any references here are made solely for identification or informational purposes, without implying any affiliation, endorsement, or partnership.
We make no representations or warranties, express or implied, regarding the accuracy, completeness, or suitability of any content or products presented. Nothing on this website should be construed as legal, tax, investment, financial, medical, or other professional advice. In addition, no part of this site—including articles or product references—constitutes a solicitation, recommendation, endorsement, advertisement, or offer to buy or sell any securities, franchises, or other financial instruments, particularly in jurisdictions where such activity would be unlawful.
All content is of a general nature and may not address the specific circumstances of any individual or entity. It is not a substitute for professional advice or services. Any actions you take based on the information provided here are strictly at your own risk. You accept full responsibility for any decisions or outcomes arising from your use of this website and agree to release us from any liability in connection with your use of, or reliance upon, the content or products found herein.