
|
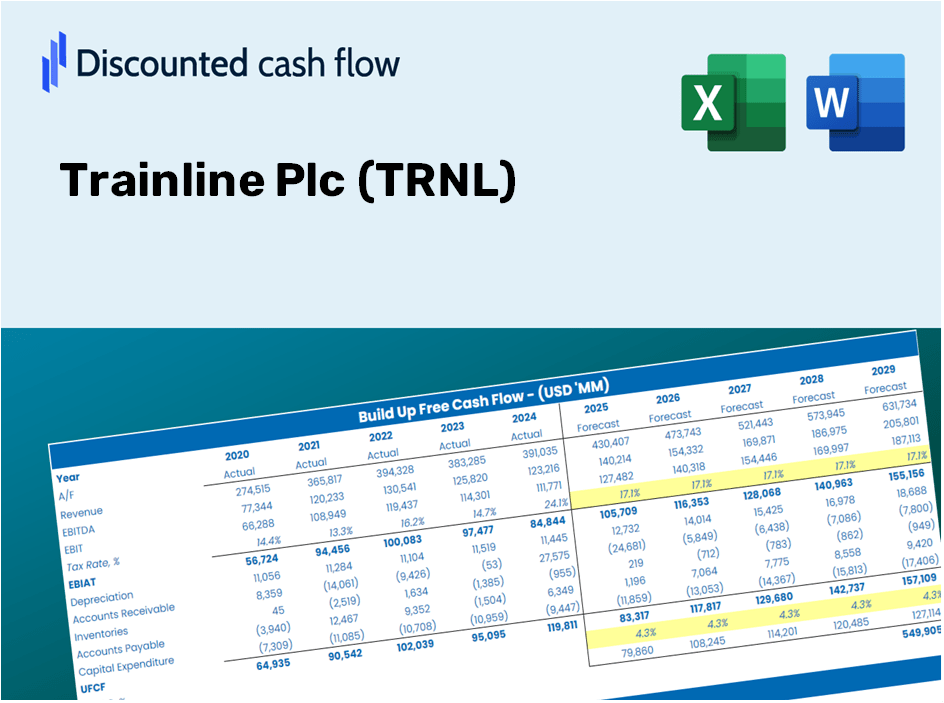
Avaliação DCF da linha de trem PLC (TRN.L) |
Totalmente Editável: Adapte-Se Às Suas Necessidades No Excel Ou Planilhas
Design Profissional: Modelos Confiáveis E Padrão Da Indústria
Pré-Construídos Para Uso Rápido E Eficiente
Compatível com MAC/PC, totalmente desbloqueado
Não É Necessária Experiência; Fácil De Seguir
Trainline Plc (TRN.L) Bundle
Explore as perspectivas financeiras do Trainline PLC (TRNL) com nossa calculadora DCF amigável! Digite suas suposições de crescimento, margens e custos para calcular o valor intrínseco do Trainline PLC (TRNL) e refine sua abordagem de investimento.
What You Will Receive
- Authentic Trainline Data: Preloaded financials – encompassing revenue to EBIT – derived from actual and projected figures.
- Comprehensive Customization: Modify all essential parameters (yellow cells) such as WACC, growth %, and tax rates.
- Instant Valuation Updates: Automatic recalculations to assess the effects of changes on Trainline's fair value.
- Flexible Excel Template: Designed for quick modifications, scenario analysis, and in-depth projections.
- Efficient and Precise: Bypass the need to build models from scratch while ensuring accuracy and adaptability.
Key Features
- Authentic Trainline Financials: Gain access to precise historical data and future forecasts that are pre-loaded.
- Tailorable Forecast Assumptions: Modify highlighted cells, such as WACC, growth rates, and margins, to fit your analysis.
- Real-Time Calculations: Enjoy automatic updates for DCF, Net Present Value (NPV), and cash flow evaluations.
- User-Friendly Dashboard: View intuitive charts and summaries to easily interpret your valuation results.
- Designed for Everyone: A straightforward, user-friendly layout ideal for investors, CFOs, and consultants alike.
How It Works
- 1. Access the Template: Download and open the Excel file populated with Trainline Plc’s (TRNL) data.
- 2. Adjust Key Inputs: Modify essential variables such as growth projections, WACC, and capital expenditures.
- 3. Instant Results: The DCF model automatically computes intrinsic value and NPV based on your adjustments.
- 4. Explore Different Scenarios: Test various forecasts to evaluate alternative valuation outcomes.
- 5. Make Informed Decisions: Present comprehensive valuation analysis to guide your strategic choices.
Why Choose This Calculator for Trainline Plc (TRNL)?
- Reliable Data: Up-to-date Trainline financials ensure dependable valuation outcomes.
- Flexible Options: Modify essential factors like growth rates, WACC, and tax rates to align with your forecasts.
- Efficient: Preconfigured calculations save you from building from the ground up.
- Professional-Quality Tool: Tailored for investors, analysts, and consultants in the transportation sector.
- Easy to Use: User-friendly design and clear, step-by-step guidance cater to all levels of expertise.
Who Can Benefit from This Product?
- Finance Students: Explore valuation methods and practice with real-world data.
- Researchers: Integrate expert models into your academic projects or studies.
- Investors: Evaluate your hypotheses and analyze valuation results for Trainline Plc (TRNL).
- Financial Analysts: Enhance your efficiency with a customizable, ready-made DCF model.
- Small Business Owners: Understand the analytical approaches used for large public firms like Trainline Plc (TRNL).
What the Template Contains
- Historical Data: Contains Trainline Plc's (TRNL) previous financials and foundational forecasts.
- DCF and Levered DCF Models: Comprehensive templates to assess Trainline Plc's (TRNL) intrinsic value.
- WACC Sheet: Pre-configured calculations for Weighted Average Cost of Capital.
- Editable Inputs: Adjust key drivers such as growth rates, EBITDA %, and CAPEX assumptions.
- Quarterly and Annual Statements: A thorough analysis of Trainline Plc's (TRNL) financials.
- Interactive Dashboard: Dynamically visualize valuation results and projections.
Disclaimer
All information, articles, and product details provided on this website are for general informational and educational purposes only. We do not claim any ownership over, nor do we intend to infringe upon, any trademarks, copyrights, logos, brand names, or other intellectual property mentioned or depicted on this site. Such intellectual property remains the property of its respective owners, and any references here are made solely for identification or informational purposes, without implying any affiliation, endorsement, or partnership.
We make no representations or warranties, express or implied, regarding the accuracy, completeness, or suitability of any content or products presented. Nothing on this website should be construed as legal, tax, investment, financial, medical, or other professional advice. In addition, no part of this site—including articles or product references—constitutes a solicitation, recommendation, endorsement, advertisement, or offer to buy or sell any securities, franchises, or other financial instruments, particularly in jurisdictions where such activity would be unlawful.
All content is of a general nature and may not address the specific circumstances of any individual or entity. It is not a substitute for professional advice or services. Any actions you take based on the information provided here are strictly at your own risk. You accept full responsibility for any decisions or outcomes arising from your use of this website and agree to release us from any liability in connection with your use of, or reliance upon, the content or products found herein.