
|
Trevi Therapeutics, Inc. (TRVI) Avaliação DCF |
Totalmente Editável: Adapte-Se Às Suas Necessidades No Excel Ou Planilhas
Design Profissional: Modelos Confiáveis E Padrão Da Indústria
Pré-Construídos Para Uso Rápido E Eficiente
Compatível com MAC/PC, totalmente desbloqueado
Não É Necessária Experiência; Fácil De Seguir
Trevi Therapeutics, Inc. (TRVI) Bundle
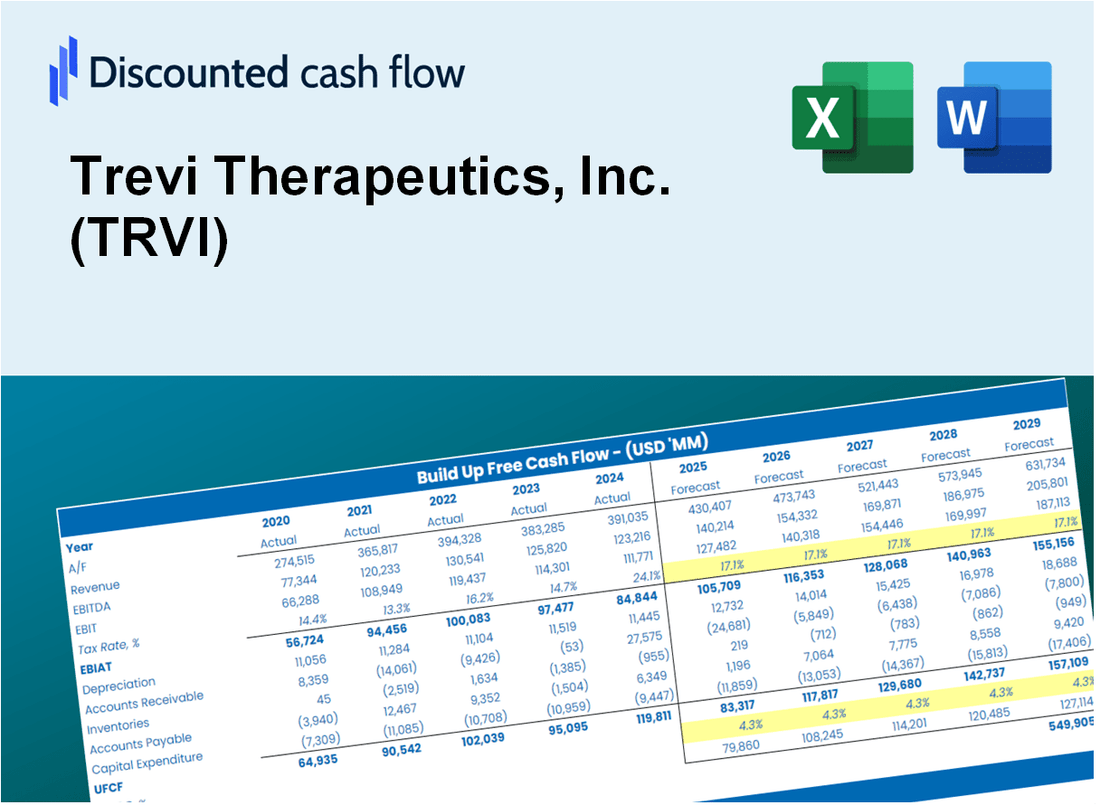
Seja você um investidor ou analista, esta calculadora DCF (TRVI) é o seu recurso preferido para uma avaliação precisa. Apresentando dados reais da Trevi Therapeutics, Inc., você pode ajustar as previsões e observar os efeitos em tempo real.
What You Will Get
- Real TRVI Financial Data: Pre-filled with Trevi Therapeutics’ historical and projected data for precise analysis.
- Fully Editable Template: Modify key inputs like revenue growth, WACC, and EBITDA % with ease.
- Automatic Calculations: See Trevi Therapeutics’ intrinsic value update instantly based on your changes.
- Professional Valuation Tool: Designed for investors, analysts, and consultants seeking accurate DCF results.
- User-Friendly Design: Simple structure and clear instructions for all experience levels.
Key Features
- 🔍 Real-Life TRVI Financials: Pre-filled historical and projected data for Trevi Therapeutics, Inc. (TRVI).
- ✏️ Fully Customizable Inputs: Adjust all critical parameters (yellow cells) like WACC, growth %, and tax rates.
- 📊 Professional DCF Valuation: Built-in formulas calculate Trevi’s intrinsic value using the Discounted Cash Flow method.
- ⚡ Instant Results: Visualize Trevi’s valuation instantly after making changes.
- Scenario Analysis: Test and compare outcomes for various financial assumptions side-by-side.
How It Works
- Download: Access the pre-built Excel file containing Trevi Therapeutics, Inc.'s (TRVI) financial data.
- Customize: Modify projections, including revenue growth, EBITDA %, and WACC.
- Update Automatically: The intrinsic value and NPV calculations refresh in real-time.
- Test Scenarios: Develop various forecasts and instantly compare results.
- Make Decisions: Utilize the valuation findings to inform your investment strategy.
Why Choose This Calculator for Trevi Therapeutics, Inc. (TRVI)?
- Accuracy: Utilizes real Trevi Therapeutics financial data for precise calculations.
- Flexibility: Allows users to easily adjust and experiment with various inputs.
- Time-Saving: Eliminate the need to create a DCF model from the ground up.
- Professional-Grade: Crafted with the expertise and usability expected at the CFO level.
- User-Friendly: Intuitive interface suitable for users without extensive financial modeling skills.
Who Should Use This Product?
- Investors: Evaluate Trevi Therapeutics’ valuation before making stock transactions.
- CFOs and Financial Analysts: Enhance valuation methodologies and validate forecasts.
- Startup Founders: Understand the valuation processes of established biotech companies like Trevi Therapeutics.
- Consultants: Provide expert valuation assessments for clients in the healthcare sector.
- Students and Educators: Utilize real-life data to learn and teach valuation strategies.
What the Template Contains
- Pre-Filled DCF Model: Trevi Therapeutics, Inc.’s (TRVI) financial data preloaded for immediate use.
- WACC Calculator: Detailed calculations for Weighted Average Cost of Capital.
- Financial Ratios: Evaluate Trevi’s profitability, leverage, and efficiency.
- Editable Inputs: Change assumptions such as growth, margins, and CAPEX to fit your scenarios.
- Financial Statements: Annual and quarterly reports to support detailed analysis.
- Interactive Dashboard: Easily visualize key valuation metrics and results.
Disclaimer
All information, articles, and product details provided on this website are for general informational and educational purposes only. We do not claim any ownership over, nor do we intend to infringe upon, any trademarks, copyrights, logos, brand names, or other intellectual property mentioned or depicted on this site. Such intellectual property remains the property of its respective owners, and any references here are made solely for identification or informational purposes, without implying any affiliation, endorsement, or partnership.
We make no representations or warranties, express or implied, regarding the accuracy, completeness, or suitability of any content or products presented. Nothing on this website should be construed as legal, tax, investment, financial, medical, or other professional advice. In addition, no part of this site—including articles or product references—constitutes a solicitation, recommendation, endorsement, advertisement, or offer to buy or sell any securities, franchises, or other financial instruments, particularly in jurisdictions where such activity would be unlawful.
All content is of a general nature and may not address the specific circumstances of any individual or entity. It is not a substitute for professional advice or services. Any actions you take based on the information provided here are strictly at your own risk. You accept full responsibility for any decisions or outcomes arising from your use of this website and agree to release us from any liability in connection with your use of, or reliance upon, the content or products found herein.