
|
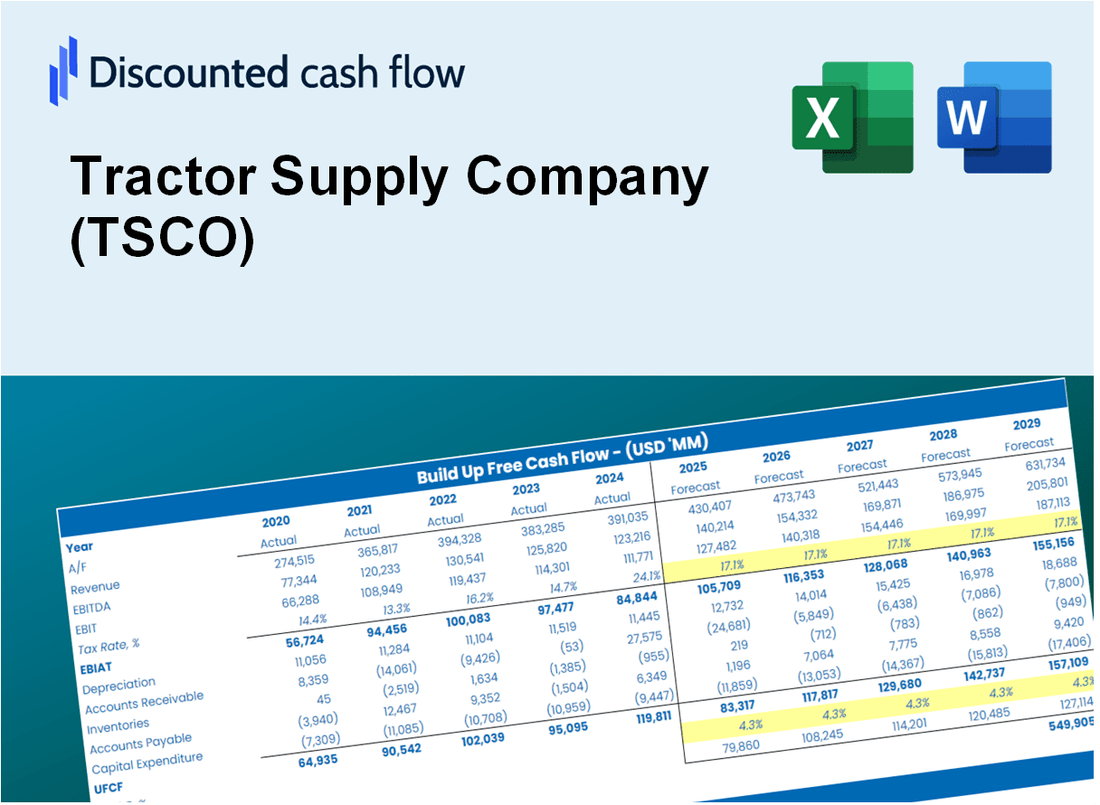
Avaliação DCF da empresa de suprimentos de tratores (TSCO) |
Totalmente Editável: Adapte-Se Às Suas Necessidades No Excel Ou Planilhas
Design Profissional: Modelos Confiáveis E Padrão Da Indústria
Pré-Construídos Para Uso Rápido E Eficiente
Compatível com MAC/PC, totalmente desbloqueado
Não É Necessária Experiência; Fácil De Seguir
Tractor Supply Company (TSCO) Bundle
Explore as perspectivas financeiras da empresa de suprimentos de tratores (TSCO) com a nossa calculadora DCF amigável! Digite suas projeções de crescimento, margens e despesas para calcular o valor intrínseco da empresa de suprimentos de tratores (TSCO) e aprimorar suas decisões de investimento.
What You Will Get
- Real TSCO Financials: Access historical and projected data for precise valuation.
- Customizable Inputs: Adjust WACC, tax rates, revenue growth, and capital expenditures as needed.
- Dynamic Calculations: Intrinsic value and NPV are computed automatically.
- Scenario Analysis: Explore various scenarios to assess Tractor Supply Company's future performance.
- User-Friendly Design: Crafted for professionals while remaining approachable for newcomers.
Key Features
- 🔍 Real-Life TSCO Financials: Pre-filled historical and projected data for Tractor Supply Company (TSCO).
- ✏️ Fully Customizable Inputs: Adjust all critical parameters (yellow cells) like WACC, growth %, and tax rates.
- 📊 Professional DCF Valuation: Built-in formulas calculate Tractor Supply's intrinsic value using the Discounted Cash Flow method.
- ⚡ Instant Results: Visualize Tractor Supply’s valuation instantly after making changes.
- Scenario Analysis: Test and compare outcomes for various financial assumptions side-by-side.
How It Works
- Step 1: Download the Excel file.
- Step 2: Review pre-entered Tractor Supply Company (TSCO) data (historical and projected).
- Step 3: Adjust key assumptions (yellow cells) based on your analysis.
- Step 4: View automatic recalculations for Tractor Supply Company’s (TSCO) intrinsic value.
- Step 5: Use the outputs for investment decisions or reporting.
Why Choose This Calculator?
- User-Friendly Interface: Tailored for both novices and seasoned users.
- Customizable Inputs: Adjust parameters easily to suit your evaluation needs.
- Real-Time Updates: Observe immediate changes to Tractor Supply Company’s valuation as you modify inputs.
- Pre-Loaded Data: Comes with Tractor Supply Company’s actual financial information for swift assessments.
- Relied Upon by Experts: Utilized by investors and analysts for making well-informed choices.
Who Should Use This Product?
- Agriculture Students: Understand supply chain dynamics and apply them using real-world data.
- Researchers: Integrate industry-specific models into academic studies or projects.
- Investors: Evaluate your investment strategies and analyze valuation results for Tractor Supply Company (TSCO).
- Market Analysts: Enhance your analysis with a customizable financial model tailored for retail.
- Farmers and Ranchers: Learn how major retail companies like Tractor Supply Company (TSCO) assess their market position.
What the Template Contains
- Preloaded TSCO Data: Historical and projected financial data, including revenue, EBIT, and capital expenditures.
- DCF and WACC Models: Professional-grade sheets for calculating intrinsic value and Weighted Average Cost of Capital.
- Editable Inputs: Yellow-highlighted cells for adjusting revenue growth, tax rates, and discount rates.
- Financial Statements: Comprehensive annual and quarterly financials for deeper analysis.
- Key Ratios: Profitability, leverage, and efficiency ratios to evaluate performance.
- Dashboard and Charts: Visual summaries of valuation outcomes and assumptions.
Disclaimer
All information, articles, and product details provided on this website are for general informational and educational purposes only. We do not claim any ownership over, nor do we intend to infringe upon, any trademarks, copyrights, logos, brand names, or other intellectual property mentioned or depicted on this site. Such intellectual property remains the property of its respective owners, and any references here are made solely for identification or informational purposes, without implying any affiliation, endorsement, or partnership.
We make no representations or warranties, express or implied, regarding the accuracy, completeness, or suitability of any content or products presented. Nothing on this website should be construed as legal, tax, investment, financial, medical, or other professional advice. In addition, no part of this site—including articles or product references—constitutes a solicitation, recommendation, endorsement, advertisement, or offer to buy or sell any securities, franchises, or other financial instruments, particularly in jurisdictions where such activity would be unlawful.
All content is of a general nature and may not address the specific circumstances of any individual or entity. It is not a substitute for professional advice or services. Any actions you take based on the information provided here are strictly at your own risk. You accept full responsibility for any decisions or outcomes arising from your use of this website and agree to release us from any liability in connection with your use of, or reliance upon, the content or products found herein.