
|
Sixth Street Specialty Lending, Inc. (TSLX) Avaliação DCF |
Totalmente Editável: Adapte-Se Às Suas Necessidades No Excel Ou Planilhas
Design Profissional: Modelos Confiáveis E Padrão Da Indústria
Pré-Construídos Para Uso Rápido E Eficiente
Compatível com MAC/PC, totalmente desbloqueado
Não É Necessária Experiência; Fácil De Seguir
Sixth Street Specialty Lending, Inc. (TSLX) Bundle
Seja você um investidor ou analista, esta calculadora DCF (TSLX) é o seu recurso essencial para uma avaliação precisa. Pré -carregado com dados reais da Sixth Street Specialty Lending, Inc., você pode modificar as previsões e observar os efeitos em tempo real.
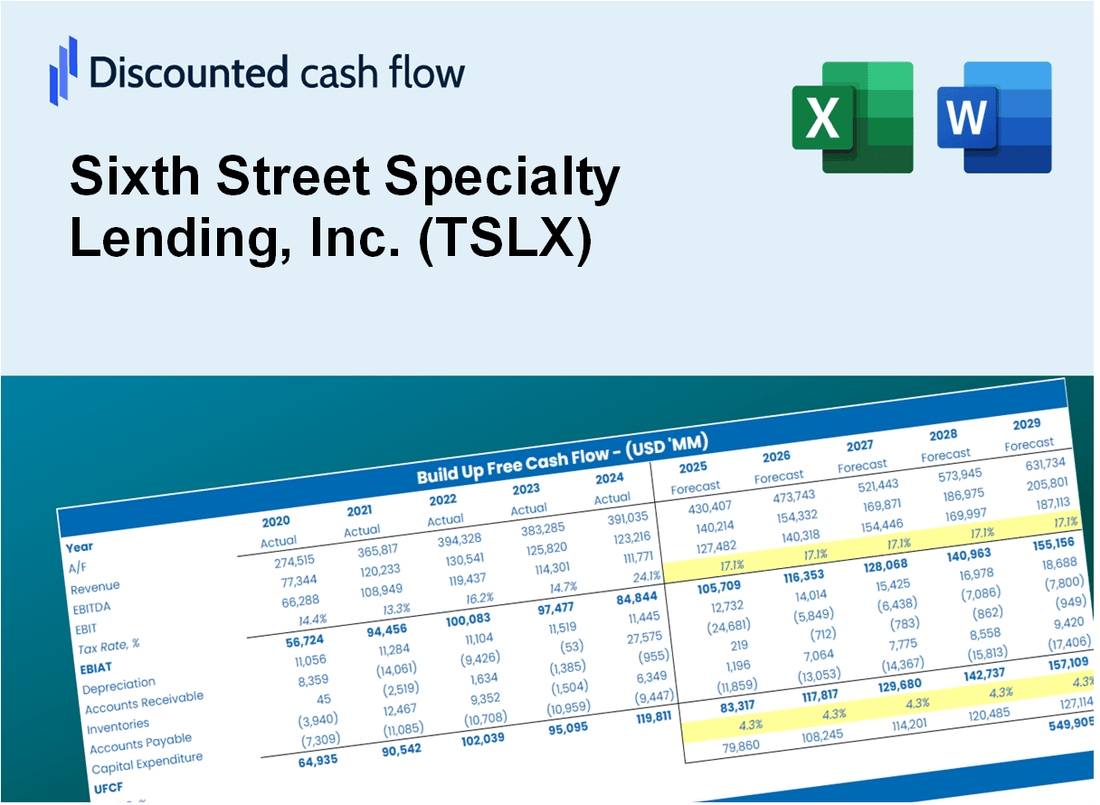
Discounted Cash Flow (DCF) - (USD MM)
| Year | AY1 2020 |
AY2 2021 |
AY3 2022 |
AY4 2023 |
AY5 2024 |
FY1 2025 |
FY2 2026 |
FY3 2027 |
FY4 2028 |
FY5 2029 |
|---|---|---|---|---|---|---|---|---|---|---|
| Revenue | 235.4 | 266.3 | 187.2 | 369.8 | 359.7 | 430.1 | 514.3 | 615.0 | 735.3 | 879.2 |
| Revenue Growth, % | 0 | 13.12 | -29.71 | 97.59 | -2.72 | 19.57 | 19.57 | 19.57 | 19.57 | 19.57 |
| EBITDA | 183.9 | 214.1 | 111.2 | 223.8 | 193.1 | 285.7 | 341.7 | 408.5 | 488.5 | 584.0 |
| EBITDA, % | 78.11 | 80.4 | 59.44 | 60.53 | 53.68 | 66.43 | 66.43 | 66.43 | 66.43 | 66.43 |
| Depreciation | .0 | .0 | .0 | .0 | .0 | .0 | .0 | .0 | .0 | .0 |
| Depreciation, % | 0 | 0 | 0 | 0 | 0 | 0 | 0 | 0 | 0 | 0 |
| EBIT | 183.9 | 214.1 | 111.2 | 223.8 | 193.1 | 285.7 | 341.7 | 408.5 | 488.5 | 584.0 |
| EBIT, % | 78.11 | 80.4 | 59.44 | 60.53 | 53.68 | 66.43 | 66.43 | 66.43 | 66.43 | 66.43 |
| Total Cash | 2.5 | 1.6 | 10.2 | 1.2 | 5.0 | 7.6 | 9.1 | 10.8 | 12.9 | 15.5 |
| Total Cash, percent | .0 | .0 | .0 | .0 | .0 | .0 | .0 | .0 | .0 | .0 |
| Account Receivables | 8.6 | 10.8 | 18.8 | 28.0 | 30.5 | 29.1 | 34.8 | 41.6 | 49.7 | 59.4 |
| Account Receivables, % | 3.65 | 4.05 | 10.07 | 7.56 | 8.48 | 6.76 | 6.76 | 6.76 | 6.76 | 6.76 |
| Inventories | .0 | .0 | .0 | .0 | .0 | .0 | .0 | .0 | .0 | .0 |
| Inventories, % | 0 | 0 | 0 | 0 | 0 | 0 | 0 | 0 | 0 | 0 |
| Accounts Payable | 27.7 | 30.9 | .0 | .0 | .0 | 20.1 | 24.1 | 28.8 | 34.4 | 41.1 |
| Accounts Payable, % | 11.78 | 11.61 | 0 | 0 | 0 | 4.68 | 4.68 | 4.68 | 4.68 | 4.68 |
| Capital Expenditure | .0 | .0 | .0 | .0 | .0 | .0 | .0 | .0 | .0 | .0 |
| Capital Expenditure, % | 0 | 0 | 0 | 0 | 0 | 0 | 0 | 0 | 0 | 0 |
| Tax Rate, % | 3.39 | 3.39 | 3.39 | 3.39 | 3.39 | 3.39 | 3.39 | 3.39 | 3.39 | 3.39 |
| EBITAT | 178.1 | 211.8 | 108.1 | 222.0 | 186.6 | 279.3 | 334.0 | 399.3 | 477.5 | 570.9 |
| Depreciation | ||||||||||
| Changes in Account Receivables | ||||||||||
| Changes in Inventories | ||||||||||
| Changes in Accounts Payable | ||||||||||
| Capital Expenditure | ||||||||||
| UFCF | 197.3 | 212.8 | 69.1 | 212.9 | 184.0 | 300.9 | 332.2 | 397.2 | 475.0 | 567.9 |
| WACC, % | 6.26 | 6.32 | 6.27 | 6.32 | 6.25 | 6.28 | 6.28 | 6.28 | 6.28 | 6.28 |
| PV UFCF | ||||||||||
| SUM PV UFCF | 1,698.9 | |||||||||
| Long Term Growth Rate, % | 2.00 | |||||||||
| Free cash flow (T + 1) | 579 | |||||||||
| Terminal Value | 13,519 | |||||||||
| Present Terminal Value | 9,968 | |||||||||
| Enterprise Value | 11,667 | |||||||||
| Net Debt | 1,896 | |||||||||
| Equity Value | 9,771 | |||||||||
| Diluted Shares Outstanding, MM | 92 | |||||||||
| Equity Value Per Share | 106.16 |
What You Will Get
- Real TSLX Financial Data: Pre-filled with Sixth Street Specialty Lending’s historical and projected data for precise analysis.
- Fully Editable Template: Modify key inputs like revenue growth, WACC, and EBITDA % with ease.
- Automatic Calculations: See Sixth Street Specialty Lending’s intrinsic value update instantly based on your changes.
- Professional Valuation Tool: Designed for investors, analysts, and consultants seeking accurate DCF results.
- User-Friendly Design: Simple structure and clear instructions for all experience levels.
Key Features
- Real-Time TSLX Data: Pre-loaded with Sixth Street Specialty Lending's historical performance and future forecasts.
- Comprehensive Customization Options: Modify inputs such as interest rates, loan terms, portfolio composition, and risk assessments.
- Interactive Valuation Framework: Automatically recalculates Net Asset Value (NAV) and intrinsic value based on your adjustments.
- Multiple Scenario Analysis: Develop various financial scenarios to evaluate different investment outcomes.
- Intuitive User Interface: Streamlined and accessible design for both seasoned investors and newcomers.
How It Works
- Download: Access the ready-to-use Excel file featuring Sixth Street Specialty Lending, Inc.'s (TSLX) financial data.
- Customize: Tailor your forecasts, including revenue growth, EBITDA %, and WACC.
- Update Automatically: The intrinsic value and NPV calculations refresh in real-time.
- Test Scenarios: Generate multiple projections and compare results instantly.
- Make Decisions: Leverage the valuation outcomes to inform your investment strategy.
Why Choose This Calculator for Sixth Street Specialty Lending, Inc. (TSLX)?
- Comprehensive Tool: Offers DCF, WACC, and financial ratio analyses all in one convenient package.
- Customizable Inputs: Modify yellow-highlighted cells to explore different financial scenarios.
- Detailed Insights: Automatically computes Sixth Street Specialty Lending's intrinsic value and Net Present Value.
- Preloaded Data: Historical and projected data provide reliable starting points for analysis.
- Professional Quality: Perfect for financial analysts, investors, and business consultants focused on TSLX.
Who Should Use This Product?
- Individual Investors: Make informed decisions about buying or selling Sixth Street Specialty Lending, Inc. (TSLX) stock.
- Financial Analysts: Streamline valuation processes with ready-to-use financial models for Sixth Street Specialty Lending, Inc. (TSLX).
- Consultants: Deliver professional valuation insights on Sixth Street Specialty Lending, Inc. (TSLX) to clients quickly and accurately.
- Business Owners: Understand how specialty lending companies like Sixth Street Specialty Lending, Inc. (TSLX) are valued to guide your own strategy.
- Finance Students: Learn valuation techniques using real-world data and scenarios related to Sixth Street Specialty Lending, Inc. (TSLX).
What the Template Contains
- Comprehensive DCF Model: Editable template with detailed valuation calculations tailored for Sixth Street Specialty Lending, Inc. (TSLX).
- Real-World Data: Sixth Street Specialty Lending’s historical and projected financials preloaded for analysis.
- Customizable Parameters: Adjust WACC, growth rates, and tax assumptions to test various scenarios.
- Financial Statements: Complete annual and quarterly breakdowns for in-depth insights.
- Key Ratios: Built-in analysis for profitability, efficiency, and leverage specific to Sixth Street Specialty Lending, Inc. (TSLX).
- Dashboard with Visual Outputs: Charts and tables for clear, actionable results related to Sixth Street Specialty Lending, Inc. (TSLX).
Disclaimer
All information, articles, and product details provided on this website are for general informational and educational purposes only. We do not claim any ownership over, nor do we intend to infringe upon, any trademarks, copyrights, logos, brand names, or other intellectual property mentioned or depicted on this site. Such intellectual property remains the property of its respective owners, and any references here are made solely for identification or informational purposes, without implying any affiliation, endorsement, or partnership.
We make no representations or warranties, express or implied, regarding the accuracy, completeness, or suitability of any content or products presented. Nothing on this website should be construed as legal, tax, investment, financial, medical, or other professional advice. In addition, no part of this site—including articles or product references—constitutes a solicitation, recommendation, endorsement, advertisement, or offer to buy or sell any securities, franchises, or other financial instruments, particularly in jurisdictions where such activity would be unlawful.
All content is of a general nature and may not address the specific circumstances of any individual or entity. It is not a substitute for professional advice or services. Any actions you take based on the information provided here are strictly at your own risk. You accept full responsibility for any decisions or outcomes arising from your use of this website and agree to release us from any liability in connection with your use of, or reliance upon, the content or products found herein.