
|
Tyson Foods, Inc. (TSN) DCF Avaliação |
Totalmente Editável: Adapte-Se Às Suas Necessidades No Excel Ou Planilhas
Design Profissional: Modelos Confiáveis E Padrão Da Indústria
Pré-Construídos Para Uso Rápido E Eficiente
Compatível com MAC/PC, totalmente desbloqueado
Não É Necessária Experiência; Fácil De Seguir
Tyson Foods, Inc. (TSN) Bundle
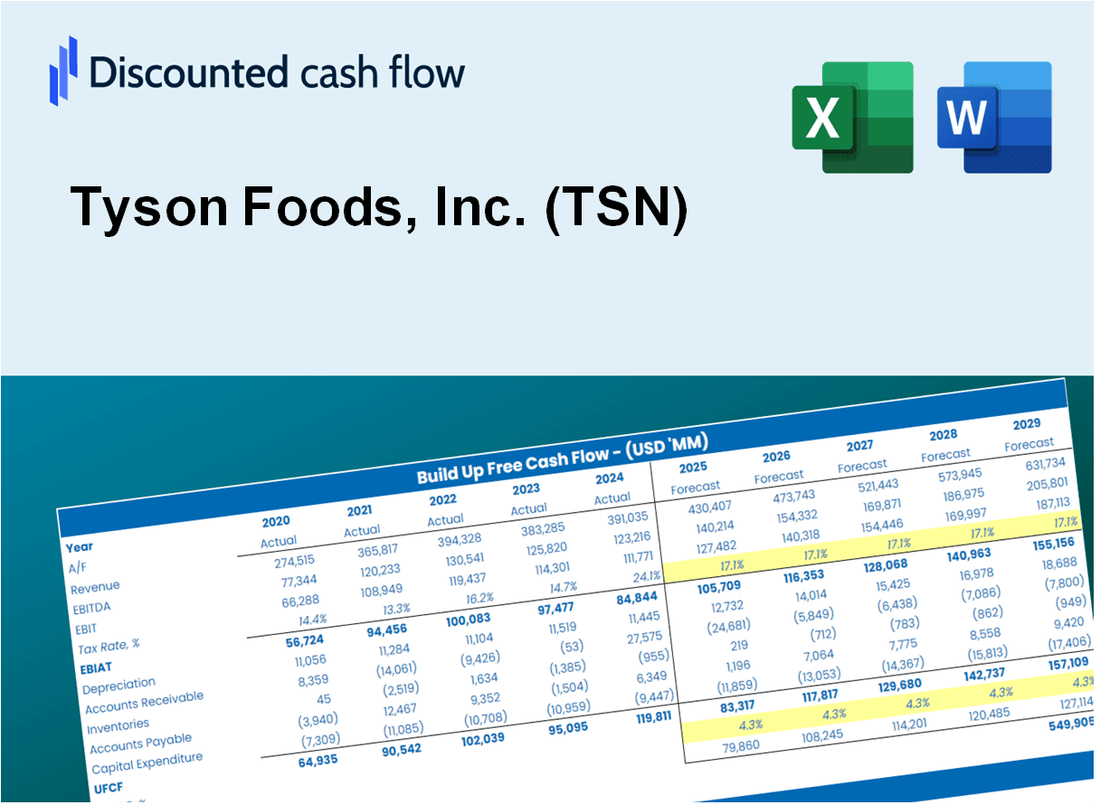
Ganhe domínio sobre sua análise de avaliação Tyson Foods, Inc. (TSN) usando nossa sofisticada calculadora DCF! Equipado com dados reais (TSN), esse modelo do Excel permite ajustar as previsões e suposições para determinar o valor intrínseco da Tyson Foods, Inc. (TSN) com precisão.
What You Will Get
- Editable Forecast Inputs: Easily modify assumptions (growth %, margins, WACC) to explore various scenarios.
- Real-World Data: Tyson Foods, Inc. (TSN)’s financial data pre-filled to kickstart your analysis.
- Automatic DCF Outputs: The template computes Net Present Value (NPV) and intrinsic value for you.
- Customizable and Professional: A refined Excel model that adjusts to your valuation requirements.
- Built for Analysts and Investors: Perfect for testing projections, validating strategies, and enhancing efficiency.
Key Features
- Accurate Tyson Financials: Gain access to reliable pre-loaded historical data and future projections specific to Tyson Foods, Inc. (TSN).
- Tailored Forecast Assumptions: Modify yellow-highlighted cells such as WACC, growth rates, and profit margins to suit your analysis.
- Real-Time Calculations: Enjoy automatic updates for DCF, Net Present Value (NPV), and cash flow assessments.
- Interactive Dashboard: Utilize user-friendly charts and summaries to effectively visualize your valuation results.
- Designed for All Users: A straightforward, intuitive layout catering to investors, CFOs, and consultants alike.
How It Works
- Step 1: Download the Excel file.
- Step 2: Review pre-entered Tyson Foods data (historical and projected).
- Step 3: Adjust key assumptions (yellow cells) based on your analysis.
- Step 4: View automatic recalculations for Tyson Foods’ intrinsic value.
- Step 5: Use the outputs for investment decisions or reporting.
Why Choose This Calculator for Tyson Foods, Inc. (TSN)?
- Accurate Data: Access real Tyson Foods financials for dependable valuation outcomes.
- Customizable: Modify essential parameters such as growth rates, WACC, and tax rates to align with your forecasts.
- Time-Saving: Pre-configured calculations save you from starting from scratch.
- Professional-Grade Tool: Tailored for investors, analysts, and consultants in the food industry.
- User-Friendly: An intuitive design and step-by-step guidance ensure ease of use for everyone.
Who Should Use This Product?
- Finance Students: Master valuation methodologies and practice with real-world data specific to Tyson Foods, Inc. (TSN).
- Academics: Integrate industry-standard models into your teaching or research focused on Tyson Foods, Inc. (TSN).
- Investors: Validate your investment hypotheses and evaluate the valuation metrics for Tyson Foods, Inc. (TSN).
- Analysts: Enhance your analysis efficiency with a ready-to-use, customizable DCF model tailored for Tyson Foods, Inc. (TSN).
- Small Business Owners: Understand the analytical approaches used for large public companies like Tyson Foods, Inc. (TSN).
What the Template Contains
- Pre-Filled Data: Includes Tyson Foods’ historical financials and forecasts.
- Discounted Cash Flow Model: Editable DCF valuation model with automatic calculations.
- Weighted Average Cost of Capital (WACC): A dedicated sheet for calculating WACC based on custom inputs.
- Key Financial Ratios: Analyze Tyson Foods’ profitability, efficiency, and leverage.
- Customizable Inputs: Edit revenue growth, margins, and tax rates with ease.
- Clear Dashboard: Charts and tables summarizing key valuation results.
Disclaimer
All information, articles, and product details provided on this website are for general informational and educational purposes only. We do not claim any ownership over, nor do we intend to infringe upon, any trademarks, copyrights, logos, brand names, or other intellectual property mentioned or depicted on this site. Such intellectual property remains the property of its respective owners, and any references here are made solely for identification or informational purposes, without implying any affiliation, endorsement, or partnership.
We make no representations or warranties, express or implied, regarding the accuracy, completeness, or suitability of any content or products presented. Nothing on this website should be construed as legal, tax, investment, financial, medical, or other professional advice. In addition, no part of this site—including articles or product references—constitutes a solicitation, recommendation, endorsement, advertisement, or offer to buy or sell any securities, franchises, or other financial instruments, particularly in jurisdictions where such activity would be unlawful.
All content is of a general nature and may not address the specific circumstances of any individual or entity. It is not a substitute for professional advice or services. Any actions you take based on the information provided here are strictly at your own risk. You accept full responsibility for any decisions or outcomes arising from your use of this website and agree to release us from any liability in connection with your use of, or reliance upon, the content or products found herein.