
|
2SEVENTE BIO, INC. (TSVT) Avaliação DCF |
Totalmente Editável: Adapte-Se Às Suas Necessidades No Excel Ou Planilhas
Design Profissional: Modelos Confiáveis E Padrão Da Indústria
Pré-Construídos Para Uso Rápido E Eficiente
Compatível com MAC/PC, totalmente desbloqueado
Não É Necessária Experiência; Fácil De Seguir
2seventy bio, Inc. (TSVT) Bundle
Aprimore suas opções de investimento com a calculadora DCF 2SEVENDE BIO, INC. (TSVT)! Explore dados financeiros reais, ajuste as projeções e despesas de crescimento e observe instantaneamente como essas modificações afetam o valor intrínseco da 2SeVenty Bio, Inc. (TSVT).
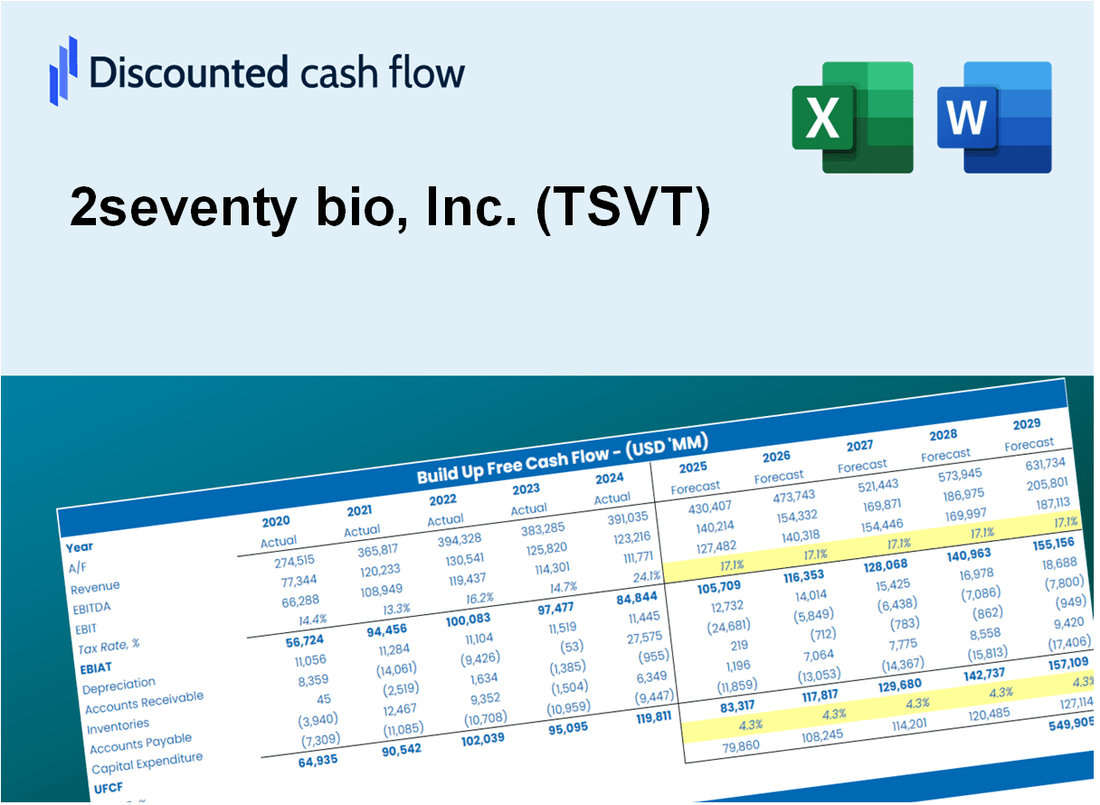
Discounted Cash Flow (DCF) - (USD MM)
| Year | AY1 2020 |
AY2 2021 |
AY3 2022 |
AY4 2023 |
AY5 2024 |
FY1 2025 |
FY2 2026 |
FY3 2027 |
FY4 2028 |
FY5 2029 |
|---|---|---|---|---|---|---|---|---|---|---|
| Revenue | 248.1 | 54.5 | 91.5 | 100.4 | 37.9 | 31.9 | 26.9 | 22.7 | 19.1 | 16.1 |
| Revenue Growth, % | 0 | -78.03 | 67.81 | 9.72 | -62.28 | -15.69 | -15.69 | -15.69 | -15.69 | -15.69 |
| EBITDA | -131.5 | -297.2 | -251.4 | -206.4 | -115.4 | -28.9 | -24.4 | -20.6 | -17.3 | -14.6 |
| EBITDA, % | -52.98 | -545.03 | -274.74 | -205.62 | -304.87 | -90.6 | -90.6 | -90.6 | -90.6 | -90.6 |
| Depreciation | 13.2 | 16.4 | 11.5 | 10.3 | 7.1 | 4.9 | 4.1 | 3.5 | 2.9 | 2.5 |
| Depreciation, % | 5.32 | 30.08 | 12.6 | 10.25 | 18.74 | 15.4 | 15.4 | 15.4 | 15.4 | 15.4 |
| EBIT | -144.6 | -313.6 | -262.9 | -216.7 | -122.5 | -29.3 | -24.7 | -20.8 | -17.5 | -14.8 |
| EBIT, % | -58.29 | -575.11 | -287.34 | -215.87 | -323.61 | -91.66 | -91.66 | -91.66 | -91.66 | -91.66 |
| Total Cash | -127.6 | 362.2 | 266.3 | 217.0 | 174.8 | 22.3 | 18.8 | 15.8 | 13.3 | 11.2 |
| Total Cash, percent | .0 | .0 | .0 | .0 | .0 | .0 | .0 | .0 | .0 | .0 |
| Account Receivables | 10.7 | 17.0 | 21.0 | 13.4 | 7.8 | 5.9 | 5.0 | 4.2 | 3.5 | 3.0 |
| Account Receivables, % | 4.31 | 31.17 | 22.91 | 13.36 | 20.55 | 18.46 | 18.46 | 18.46 | 18.46 | 18.46 |
| Inventories | 127.6 | -114.1 | 13.6 | .0 | .0 | -2.1 | -1.8 | -1.5 | -1.3 | -1.1 |
| Inventories, % | 51.43 | -209.31 | 14.91 | 0 | 0 | -6.73 | -6.73 | -6.73 | -6.73 | -6.73 |
| Accounts Payable | 7.2 | 6.0 | 7.2 | 6.0 | 1.1 | 2.0 | 1.6 | 1.4 | 1.2 | 1.0 |
| Accounts Payable, % | 2.88 | 11.05 | 7.88 | 6 | 2.79 | 6.12 | 6.12 | 6.12 | 6.12 | 6.12 |
| Capital Expenditure | -22.3 | -19.6 | -22.8 | -13.9 | -.7 | -5.5 | -4.6 | -3.9 | -3.3 | -2.8 |
| Capital Expenditure, % | -8.97 | -35.9 | -24.97 | -13.81 | -1.87 | -17.1 | -17.1 | -17.1 | -17.1 | -17.1 |
| Tax Rate, % | 0 | 0 | 0 | 0 | 0 | 0 | 0 | 0 | 0 | 0 |
| EBITAT | -166.4 | -296.4 | -262.9 | -216.7 | -122.5 | -28.9 | -24.4 | -20.6 | -17.3 | -14.6 |
| Depreciation | ||||||||||
| Changes in Account Receivables | ||||||||||
| Changes in Inventories | ||||||||||
| Changes in Accounts Payable | ||||||||||
| Capital Expenditure | ||||||||||
| UFCF | -306.6 | -65.3 | -404.7 | -200.3 | -115.5 | -24.5 | -24.6 | -20.7 | -17.5 | -14.7 |
| WACC, % | 6.61 | 6.51 | 6.61 | 6.61 | 6.61 | 6.59 | 6.59 | 6.59 | 6.59 | 6.59 |
| PV UFCF | ||||||||||
| SUM PV UFCF | -86.0 | |||||||||
| Long Term Growth Rate, % | 2.00 | |||||||||
| Free cash flow (T + 1) | -15 | |||||||||
| Terminal Value | -327 | |||||||||
| Present Terminal Value | -238 | |||||||||
| Enterprise Value | -324 | |||||||||
| Net Debt | 172 | |||||||||
| Equity Value | -496 | |||||||||
| Diluted Shares Outstanding, MM | 52 | |||||||||
| Equity Value Per Share | -9.50 |
What You Will Get
- Pre-Filled Financial Model: 2seventy bio, Inc.'s actual data enables precise DCF valuation.
- Full Forecast Control: Adjust revenue growth, margins, WACC, and other key drivers.
- Instant Calculations: Automatic updates ensure you see results as you make changes.
- Investor-Ready Template: A refined Excel file designed for professional-grade valuation.
- Customizable and Reusable: Tailored for flexibility, allowing repeated use for detailed forecasts.
Key Features
- 🔍 Real-Life TSVT Financials: Pre-filled historical and projected data for 2seventy bio, Inc. (TSVT).
- ✏️ Fully Customizable Inputs: Adjust all critical parameters (yellow cells) like WACC, growth %, and tax rates.
- 📊 Professional DCF Valuation: Built-in formulas calculate 2seventy bio’s intrinsic value using the Discounted Cash Flow method.
- ⚡ Instant Results: Visualize 2seventy bio’s valuation instantly after making changes.
- Scenario Analysis: Test and compare outcomes for various financial assumptions side-by-side.
How It Works
- Download: Access the ready-to-use Excel file with 2seventy bio, Inc.'s (TSVT) financial data.
- Customize: Adjust forecasts, including revenue growth, EBITDA %, and WACC.
- Update Automatically: The intrinsic value and NPV calculations update in real-time.
- Test Scenarios: Create multiple projections and compare outcomes instantly.
- Make Decisions: Use the valuation results to guide your investment strategy.
Why Choose 2seventy bio, Inc. (TSVT)?
- Innovative Solutions: Benefit from cutting-edge therapies and advancements in biotechnology.
- Proven Expertise: Backed by a team of seasoned professionals with extensive industry experience.
- Patient-Centric Approach: Focused on delivering treatments that significantly improve patient outcomes.
- Commitment to Quality: Adherence to the highest standards in research and development ensures reliability.
- Collaborative Partnerships: Engaging with leading organizations to enhance research and therapeutic options.
Who Should Use This Product?
- Investors: Accurately assess the fair value of 2seventy bio, Inc. (TSVT) before making investment choices.
- CFOs: Utilize a high-quality DCF model for financial reporting and analysis related to 2seventy bio, Inc. (TSVT).
- Consultants: Easily customize the template for valuation reports tailored to clients in the biotech sector.
- Entrepreneurs: Acquire knowledge of financial modeling practices employed by leading biotech firms.
- Educators: Implement it as a teaching resource to illustrate valuation techniques in the life sciences industry.
What the Template Contains
- Pre-Filled Data: Includes 2seventy bio, Inc.'s historical financials and forecasts.
- Discounted Cash Flow Model: Editable DCF valuation model with automatic calculations.
- Weighted Average Cost of Capital (WACC): A dedicated sheet for calculating WACC based on custom inputs.
- Key Financial Ratios: Analyze 2seventy bio, Inc.'s profitability, efficiency, and leverage.
- Customizable Inputs: Edit revenue growth, margins, and tax rates with ease.
- Clear Dashboard: Charts and tables summarizing key valuation results.
Disclaimer
All information, articles, and product details provided on this website are for general informational and educational purposes only. We do not claim any ownership over, nor do we intend to infringe upon, any trademarks, copyrights, logos, brand names, or other intellectual property mentioned or depicted on this site. Such intellectual property remains the property of its respective owners, and any references here are made solely for identification or informational purposes, without implying any affiliation, endorsement, or partnership.
We make no representations or warranties, express or implied, regarding the accuracy, completeness, or suitability of any content or products presented. Nothing on this website should be construed as legal, tax, investment, financial, medical, or other professional advice. In addition, no part of this site—including articles or product references—constitutes a solicitation, recommendation, endorsement, advertisement, or offer to buy or sell any securities, franchises, or other financial instruments, particularly in jurisdictions where such activity would be unlawful.
All content is of a general nature and may not address the specific circumstances of any individual or entity. It is not a substitute for professional advice or services. Any actions you take based on the information provided here are strictly at your own risk. You accept full responsibility for any decisions or outcomes arising from your use of this website and agree to release us from any liability in connection with your use of, or reliance upon, the content or products found herein.