
|
Take-Two Interactive Software, Inc. (TTWO) Avaliação DCF |
Totalmente Editável: Adapte-Se Às Suas Necessidades No Excel Ou Planilhas
Design Profissional: Modelos Confiáveis E Padrão Da Indústria
Pré-Construídos Para Uso Rápido E Eficiente
Compatível com MAC/PC, totalmente desbloqueado
Não É Necessária Experiência; Fácil De Seguir
Take-Two Interactive Software, Inc. (TTWO) Bundle
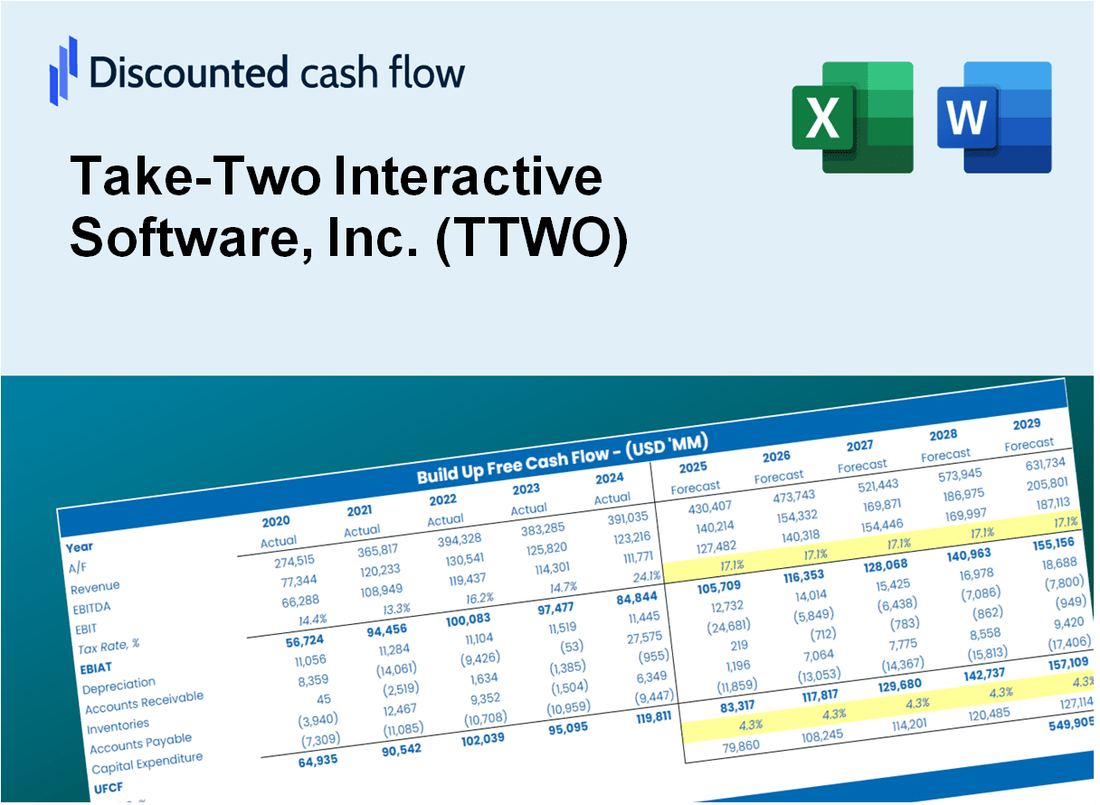
Projetado para precisão, a nossa calculadora DCF (TTWO) capacita você a avaliar a avaliação da Take-Two Interactive Software, Inc. usando dados financeiros do mundo real, oferecendo flexibilidade completa para modificar todos os parâmetros-chave para projeções aprimoradas.
Discounted Cash Flow (DCF) - (USD MM)
| Year | AY1 2021 |
AY2 2022 |
AY3 2023 |
AY4 2024 |
AY5 2025 |
FY1 2026 |
FY2 2027 |
FY3 2028 |
FY4 2029 |
FY5 2030 |
|---|---|---|---|---|---|---|---|---|---|---|
| Revenue | 3,372.8 | 3,504.8 | 5,349.9 | 5,349.6 | 5,633.6 | 6,504.9 | 7,510.9 | 8,672.5 | 10,013.7 | 11,562.4 |
| Revenue Growth, % | 0 | 3.91 | 52.64 | -0.00560758 | 5.31 | 15.47 | 15.47 | 15.47 | 15.47 | 15.47 |
| EBITDA | 890.8 | 747.0 | 582.5 | -1,800.6 | -2,979.8 | -363.5 | -419.7 | -484.6 | -559.5 | -646.1 |
| EBITDA, % | 26.41 | 21.31 | 10.89 | -33.66 | -52.89 | -5.59 | -5.59 | -5.59 | -5.59 | -5.59 |
| Depreciation | 202.4 | 257.1 | 1,776.7 | 1,761.6 | 1,342.2 | 1,343.9 | 1,551.8 | 1,791.7 | 2,068.8 | 2,388.8 |
| Depreciation, % | 6 | 7.34 | 33.21 | 32.93 | 23.82 | 20.66 | 20.66 | 20.66 | 20.66 | 20.66 |
| EBIT | 688.4 | 489.9 | -1,194.2 | -3,562.2 | -4,322.0 | -1,707.4 | -1,971.5 | -2,276.3 | -2,628.4 | -3,034.9 |
| EBIT, % | 20.41 | 13.98 | -22.32 | -66.59 | -76.72 | -26.25 | -26.25 | -26.25 | -26.25 | -26.25 |
| Total Cash | 2,731.6 | 2,552.2 | 1,014.4 | 776.0 | 1,465.5 | 2,774.8 | 3,204.0 | 3,699.5 | 4,271.6 | 4,932.2 |
| Total Cash, percent | .0 | .0 | .0 | .0 | .0 | .0 | .0 | .0 | .0 | .0 |
| Account Receivables | 658.3 | 684.3 | 843.1 | 764.7 | 851.9 | 1,095.7 | 1,265.1 | 1,460.8 | 1,686.7 | 1,947.5 |
| Account Receivables, % | 19.52 | 19.52 | 15.76 | 14.29 | 15.12 | 16.84 | 16.84 | 16.84 | 16.84 | 16.84 |
| Inventories | 17.7 | 13.2 | .0 | .0 | .0 | 11.8 | 13.6 | 15.7 | 18.1 | 20.9 |
| Inventories, % | 0.52603 | 0.37731 | 0 | 0 | 0 | 0.18067 | 0.18067 | 0.18067 | 0.18067 | 0.18067 |
| Accounts Payable | 71.0 | 125.9 | 140.1 | 195.9 | 194.7 | 200.8 | 231.8 | 267.7 | 309.1 | 356.9 |
| Accounts Payable, % | 2.11 | 3.59 | 2.62 | 3.66 | 3.46 | 3.09 | 3.09 | 3.09 | 3.09 | 3.09 |
| Capital Expenditure | -68.9 | -158.6 | -204.2 | -141.7 | -169.4 | -208.7 | -241.0 | -278.3 | -321.3 | -371.0 |
| Capital Expenditure, % | -2.04 | -4.53 | -3.82 | -2.65 | -3.01 | -3.21 | -3.21 | -3.21 | -3.21 | -3.21 |
| Tax Rate, % | 0.27609 | 0.27609 | 0.27609 | 0.27609 | 0.27609 | 0.27609 | 0.27609 | 0.27609 | 0.27609 | 0.27609 |
| EBITAT | 598.1 | 440.0 | -1,003.7 | -3,602.0 | -4,310.1 | -1,572.4 | -1,815.6 | -2,096.4 | -2,420.6 | -2,795.0 |
| Depreciation | ||||||||||
| Changes in Account Receivables | ||||||||||
| Changes in Inventories | ||||||||||
| Changes in Accounts Payable | ||||||||||
| Capital Expenditure | ||||||||||
| UFCF | 126.5 | 571.9 | 437.4 | -1,847.9 | -3,225.7 | -686.6 | -645.0 | -744.8 | -860.0 | -993.0 |
| WACC, % | 7.82 | 7.83 | 7.81 | 7.87 | 7.87 | 7.84 | 7.84 | 7.84 | 7.84 | 7.84 |
| PV UFCF | ||||||||||
| SUM PV UFCF | -3,102.0 | |||||||||
| Long Term Growth Rate, % | 2.00 | |||||||||
| Free cash flow (T + 1) | -1,013 | |||||||||
| Terminal Value | -17,345 | |||||||||
| Present Terminal Value | -11,893 | |||||||||
| Enterprise Value | -14,995 | |||||||||
| Net Debt | 2,650 | |||||||||
| Equity Value | -17,644 | |||||||||
| Diluted Shares Outstanding, MM | 175 | |||||||||
| Equity Value Per Share | -100.77 |
What You Will Get
- Real TTWO Financials: Access to historical and projected data for precise valuation.
- Adjustable Inputs: Customize WACC, tax rates, revenue growth, and capital expenditures.
- Automatic Calculations: Intrinsic value and NPV are computed in real-time.
- Scenario Analysis: Evaluate various scenarios to assess Take-Two’s future performance.
- Clear and Intuitive Design: Designed for professionals while remaining user-friendly for novices.
Key Features
- Accurate Financial Data: Gain access to precise historical data and future projections specific to Take-Two Interactive Software, Inc. (TTWO).
- Adjustable Forecast Parameters: Modify highlighted cells for key metrics such as WACC, growth rates, and profit margins.
- Real-Time Calculations: Instant updates for DCF, Net Present Value (NPV), and cash flow analyses.
- User-Friendly Dashboard: Intuitive charts and summaries for easy visualization of your valuation outcomes.
- Designed for All Skill Levels: A straightforward, user-friendly design tailored for investors, CFOs, and consultants alike.
How It Works
- Download: Access the ready-to-use Excel file with Take-Two Interactive Software, Inc. (TTWO) financial data.
- Customize: Adjust forecasts, including revenue growth, EBITDA %, and WACC specific to (TTWO).
- Update Automatically: The intrinsic value and NPV calculations for (TTWO) update in real-time.
- Test Scenarios: Create multiple projections for (TTWO) and compare outcomes instantly.
- Make Decisions: Use the valuation results for (TTWO) to guide your investment strategy.
Why Choose This Calculator?
- Accurate Data: Real Take-Two Interactive financials ensure reliable valuation results.
- Customizable: Adjust key parameters like growth rates, WACC, and tax rates to match your projections.
- Time-Saving: Pre-built calculations eliminate the need to start from scratch.
- Professional-Grade Tool: Designed for investors, analysts, and consultants.
- User-Friendly: Intuitive layout and step-by-step instructions make it easy for all users.
Who Should Use This Product?
- Game Development Students: Explore game valuation methods and implement them using real industry data.
- Researchers: Integrate professional gaming models into academic studies or projects.
- Investors: Validate your hypotheses and evaluate valuation metrics for Take-Two Interactive Software, Inc. (TTWO).
- Market Analysts: Enhance your processes with a customizable financial model tailored for the gaming industry.
- Entrepreneurs: Understand the valuation techniques used for major gaming companies like Take-Two Interactive Software, Inc. (TTWO).
What the Template Contains
- Historical Data: Includes Take-Two Interactive's past financials and baseline forecasts.
- DCF and Levered DCF Models: Detailed templates to calculate Take-Two Interactive's intrinsic value.
- WACC Sheet: Pre-built calculations for Weighted Average Cost of Capital.
- Editable Inputs: Modify key drivers like growth rates, EBITDA %, and CAPEX assumptions.
- Quarterly and Annual Statements: A complete breakdown of Take-Two Interactive's financials.
- Interactive Dashboard: Visualize valuation results and projections dynamically.
Disclaimer
All information, articles, and product details provided on this website are for general informational and educational purposes only. We do not claim any ownership over, nor do we intend to infringe upon, any trademarks, copyrights, logos, brand names, or other intellectual property mentioned or depicted on this site. Such intellectual property remains the property of its respective owners, and any references here are made solely for identification or informational purposes, without implying any affiliation, endorsement, or partnership.
We make no representations or warranties, express or implied, regarding the accuracy, completeness, or suitability of any content or products presented. Nothing on this website should be construed as legal, tax, investment, financial, medical, or other professional advice. In addition, no part of this site—including articles or product references—constitutes a solicitation, recommendation, endorsement, advertisement, or offer to buy or sell any securities, franchises, or other financial instruments, particularly in jurisdictions where such activity would be unlawful.
All content is of a general nature and may not address the specific circumstances of any individual or entity. It is not a substitute for professional advice or services. Any actions you take based on the information provided here are strictly at your own risk. You accept full responsibility for any decisions or outcomes arising from your use of this website and agree to release us from any liability in connection with your use of, or reliance upon, the content or products found herein.